Volume 74, Issue 1, 1996
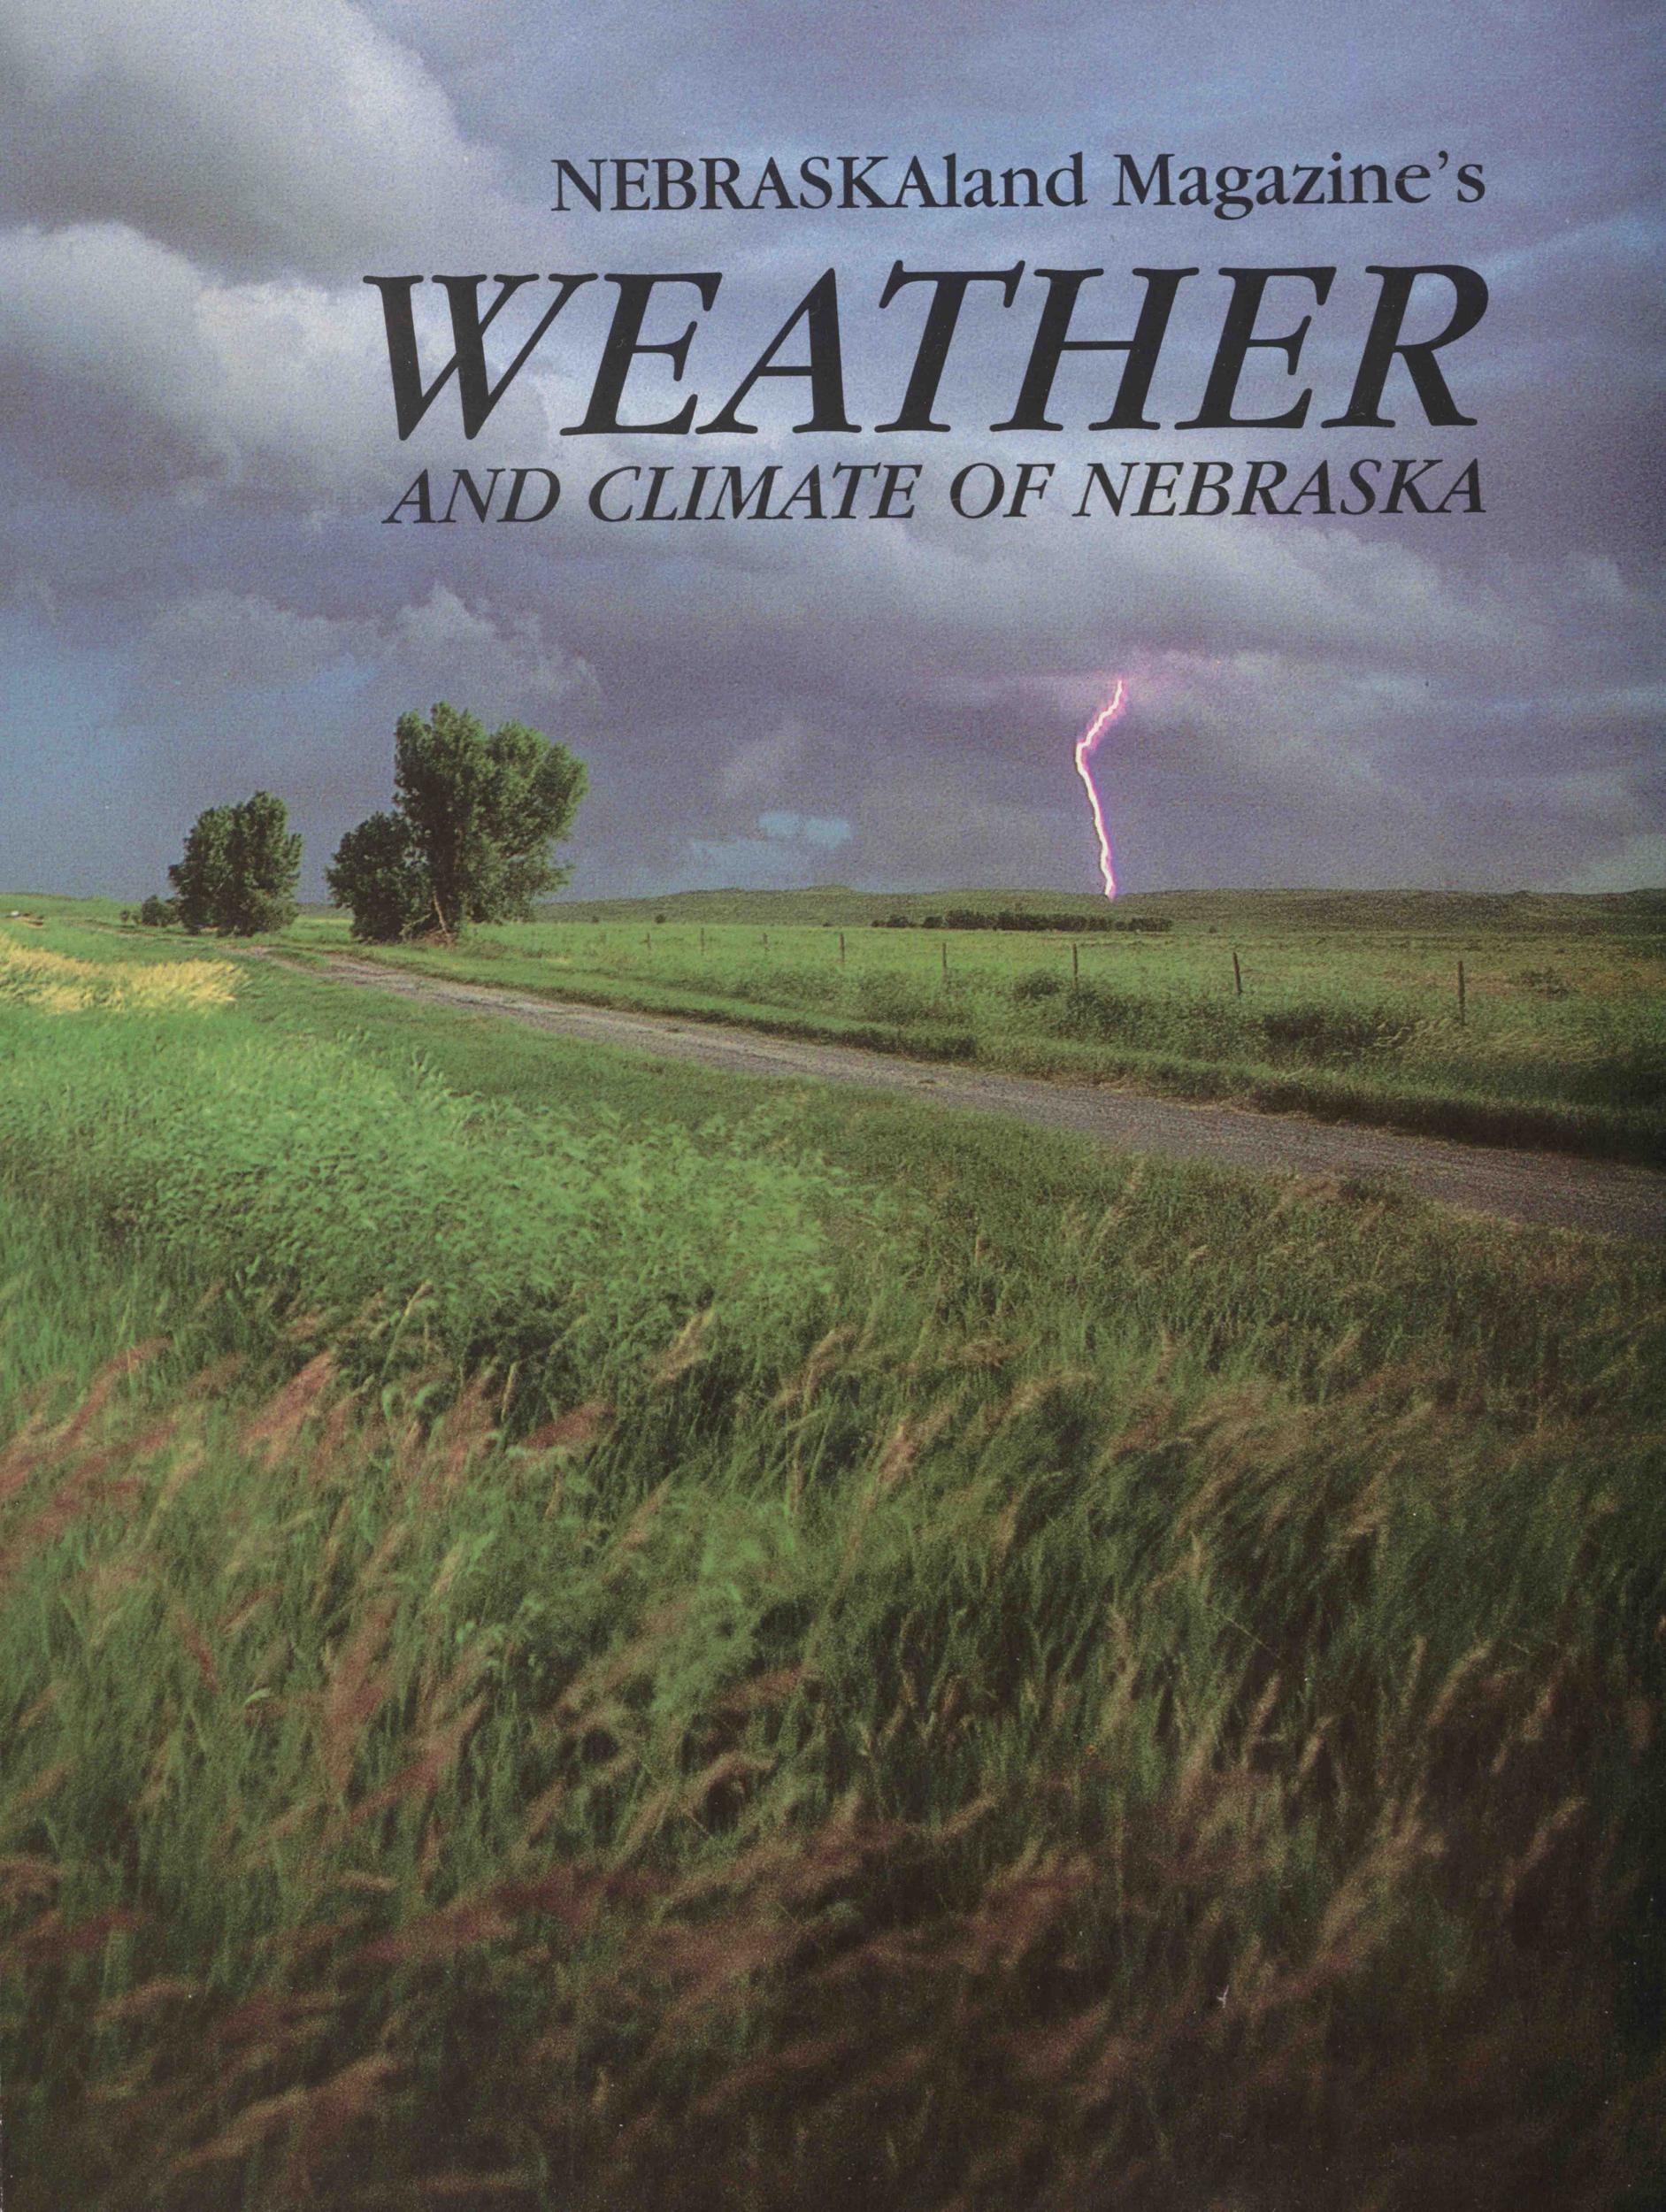
NEBRASKAland Magazine's WEATHER AND CLIMATE OF NEBRASKA
NEBRASKAland Magazine's WEATHER AND CLIMATE OF NEBRASKA
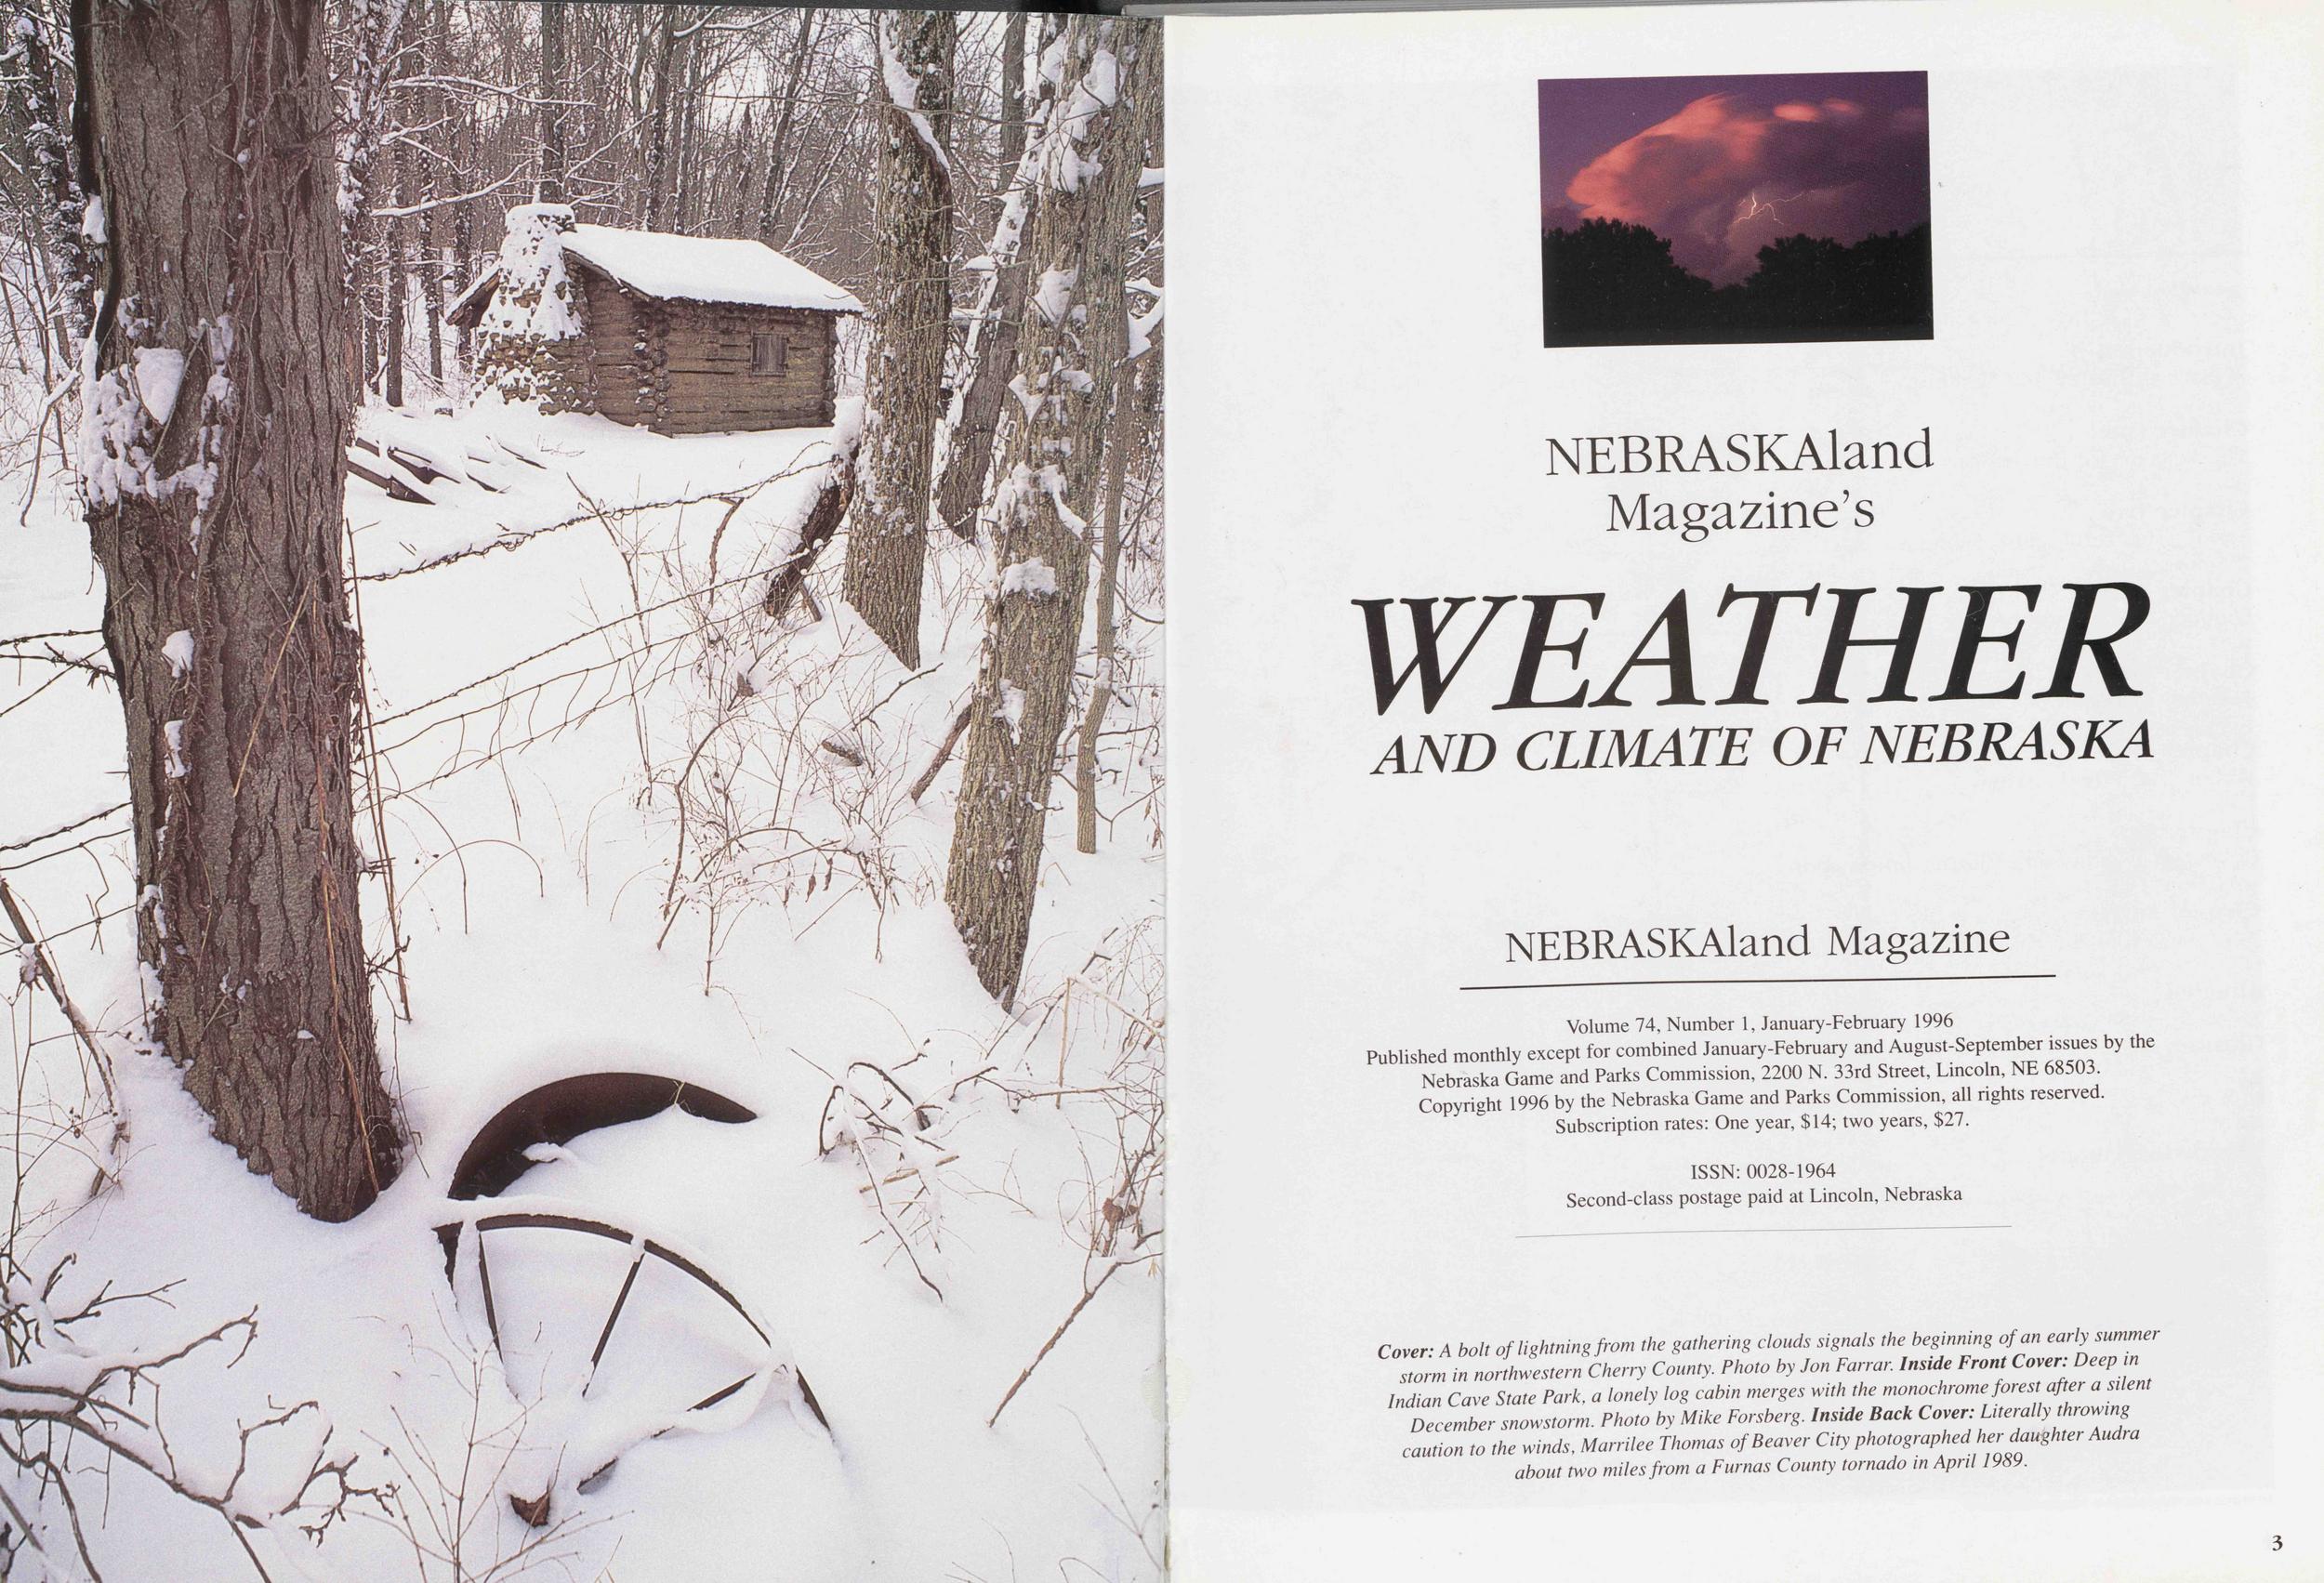
NEBRASKAland Magazine Volume 74, Number 1, January-February 1996 Published monthly except for combined January-February and August-September issues by the Nebraska Game and Parks Commission, 2200 N. 33rd Street, Lincoln, NE 68503. Copyright 1996 by the Nebraska Game and Parks Commission, all rights reserved. Subscription rates: One year, $14; two years, $27. ISSN: 0028-1964 Second-class postage paid at Lincoln, Nebraska Cover: A bolt of lightning from the gathering clouds signals the beginning of an early summer storm in northwestern Cherry County. Photo by Jon Farrar. Inside Front Cover: Deep in Indian Cave State Park, a lonely log cabin merges with the monochrome forest after a silent December snowstorm. Photo by Mike Forsberg. Inside Back Cover: Literally throwing caution to the winds, Marrilee Thomas of Beaver City photographed her daughter Audra about two miles from a Furnas County tornado in April 1989.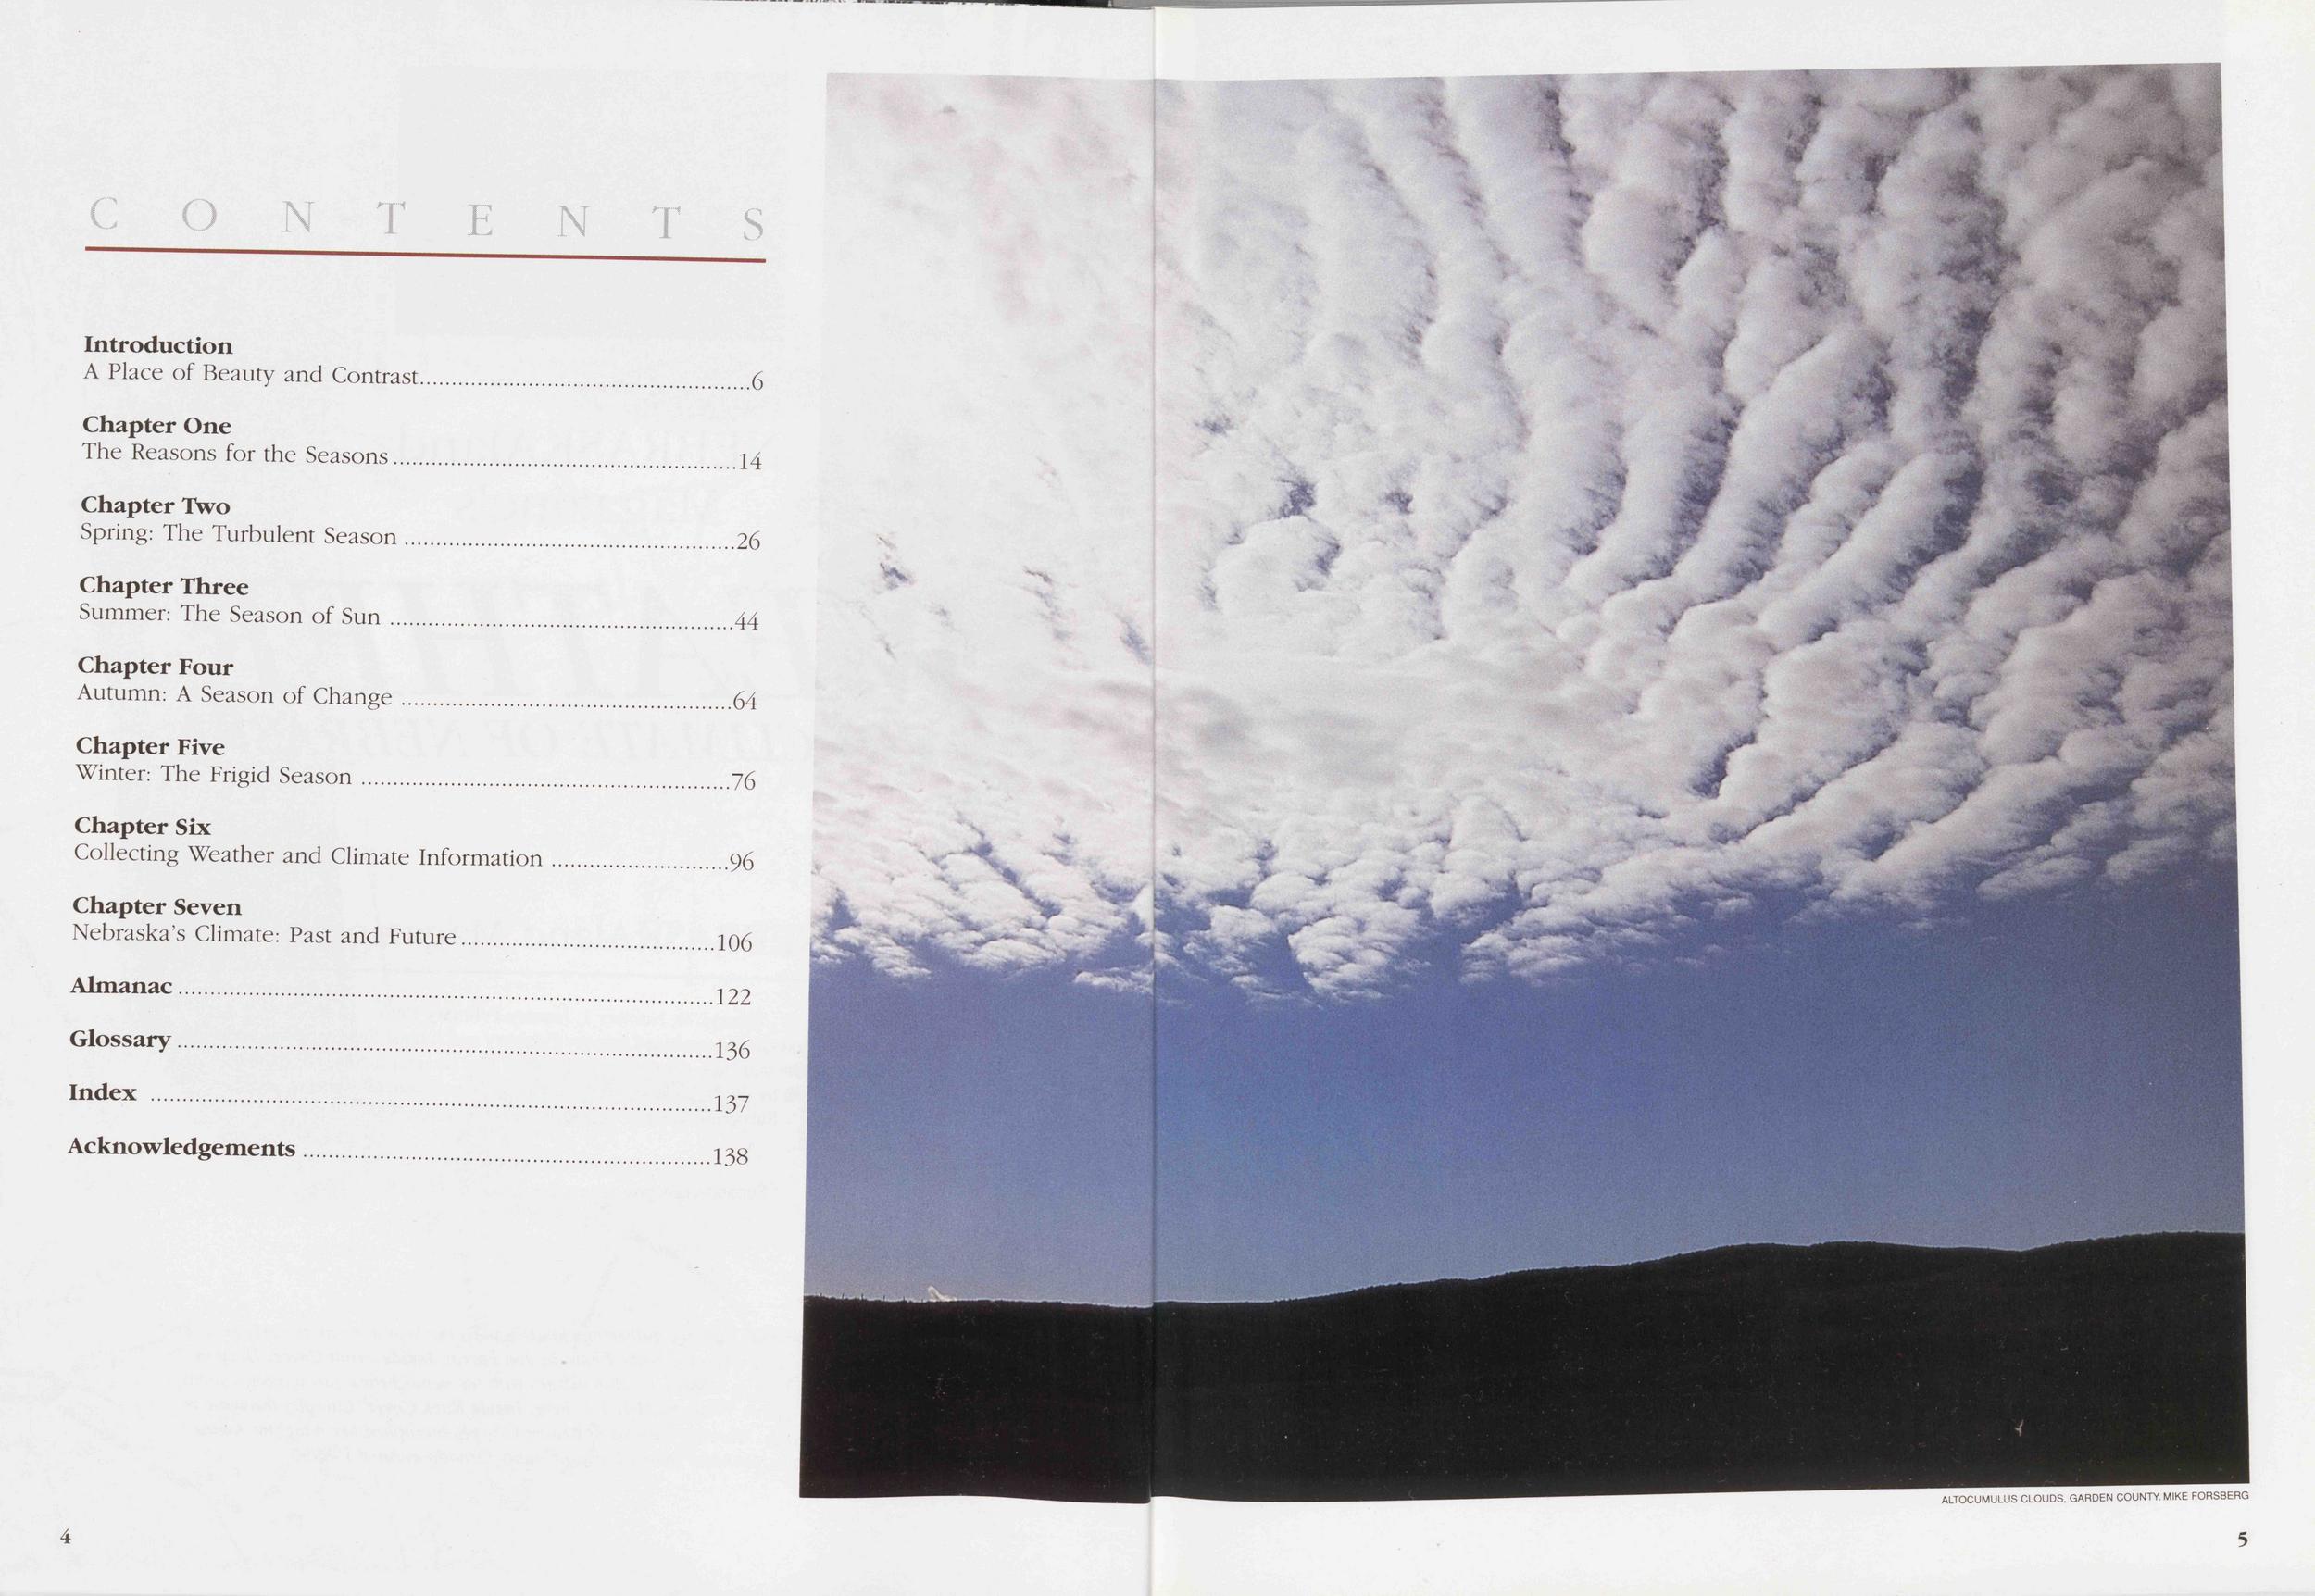 CONTENTS Introduction A Place of Beauty and Contrast....................................................6 Chapter One The Reasons for the Seasons......................................................14 Chapter Two Spring: The Turbulent Season....................................................26 Chapter Three Summer: The Season of Sun......................................................44 Chapter Four Autumn: A Season of Change....................................................64 Chapter Five Winter: The Frigid Season..........................................................76 Chapter Six Collecting Weather and Climate Information............................96 Chapter Seven Nebraska's Climate: Past and Future........................................106 Almanac....................................................................................122 Glossary....................................................................................136 Index ........................................................................................137 Acknowledgements................................................................138 4
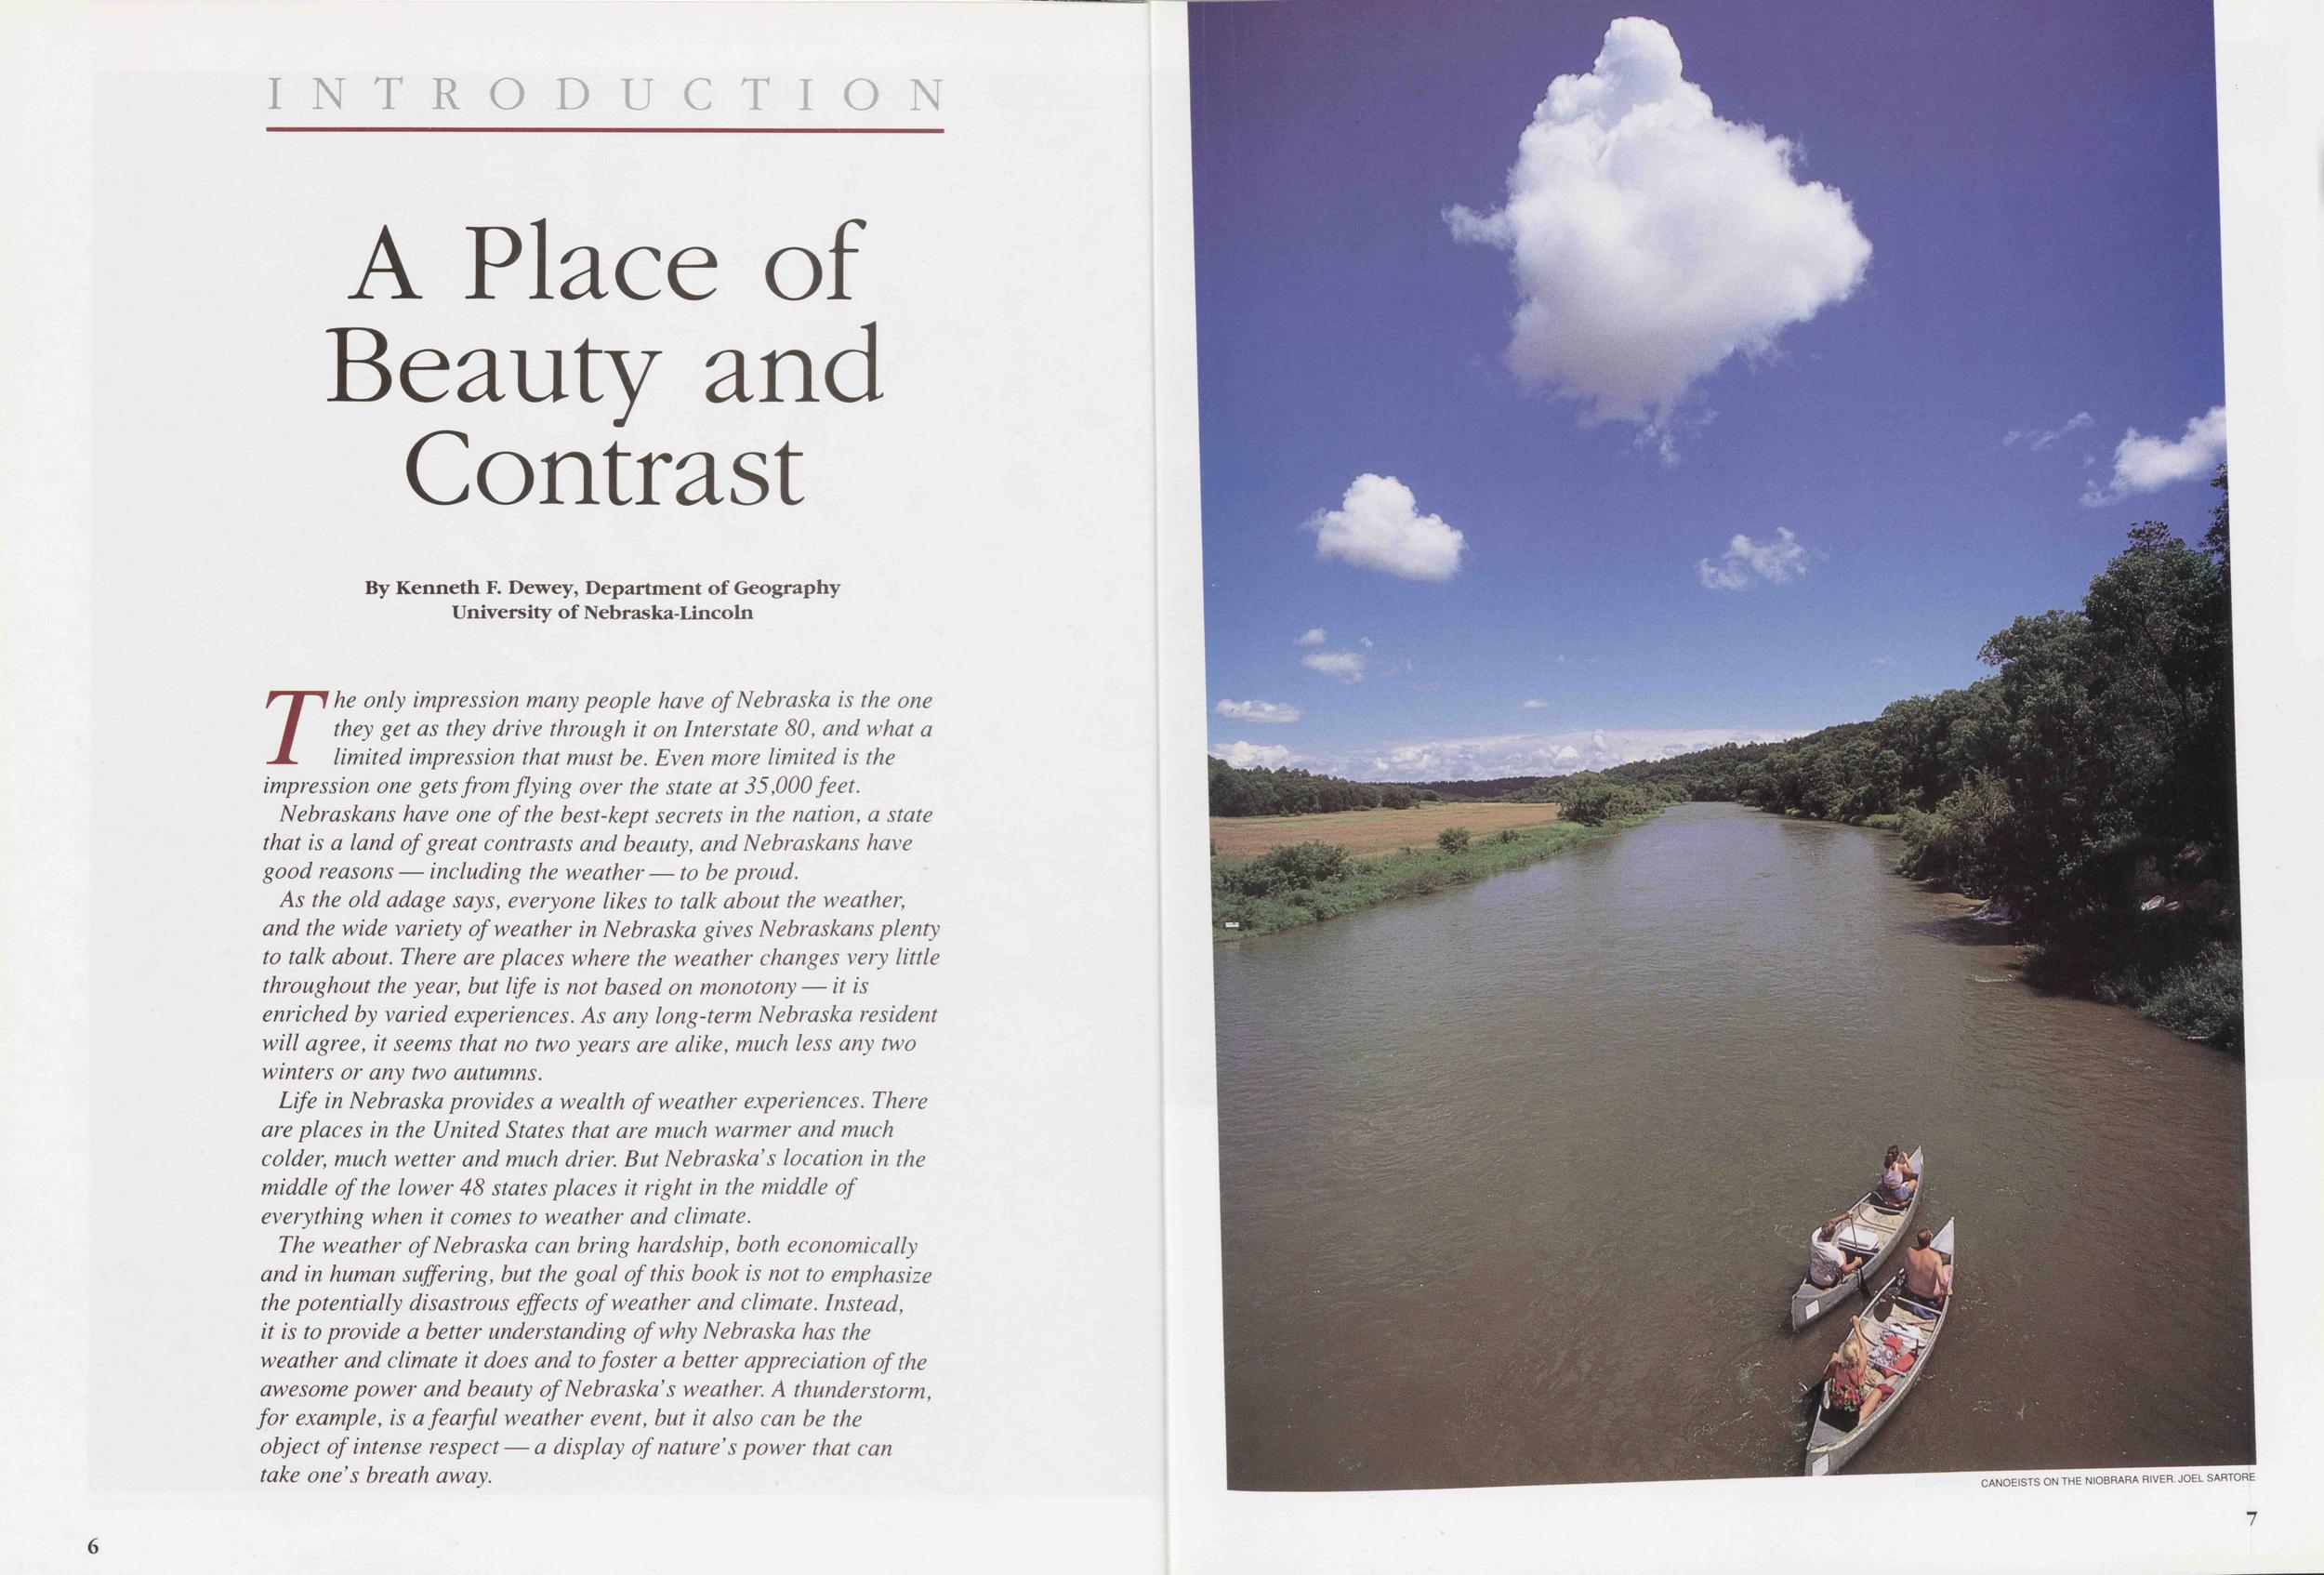
INTRO
A Place of Beauty and Contrast
By Kenneth F. Dewey, Department of Geography University of Nebraska-Lincolnrhe only impression many people have of Nebraska is the one they get as they drive through it on Interstate 80, and what a limited impression that must be. Even more limited is the impression one gets from flying over the state at 35,000 feet.
Nebraskans have one of the best-kept secrets in the nation, a state that is a land of great contrasts and beauty, and Nebraskans have good reasons — including the weather — to be proud.
As the old adage says, everyone likes to talk about the weather, and the wide variety of weather in Nebraska gives Nebraskans plenty to talk about. There are places where the weather changes very little throughout the year, but life is not based on monotony — it is enriched by varied experiences. As any long-term Nebraska resident will agree, it seems that no two years are alike, much less any two winters or any two autumns.
Life in Nebraska provides a wealth of weather experiences. There are places in the United States that are much warmer and much colder, much wetter and much drier. But Nebraska's location in the middle of the lower 48 states places it right in the middle of everything when it comes to weather and climate.
The weather of Nebraska can bring hardship, both economically and in human suffering, but the goal of this book is not to emphasize the potentially disastrous effects of weather and climate. Instead, it is to provide a better understanding of why Nebraska has the weather and climate it does and to foster a better appreciation of the awesome power and beauty of Nebraska s weather. A thunderstorm, for example, is a fearful weather event, but it also can be the object of intense respect — a display of nature's power that can take one's breath away.
6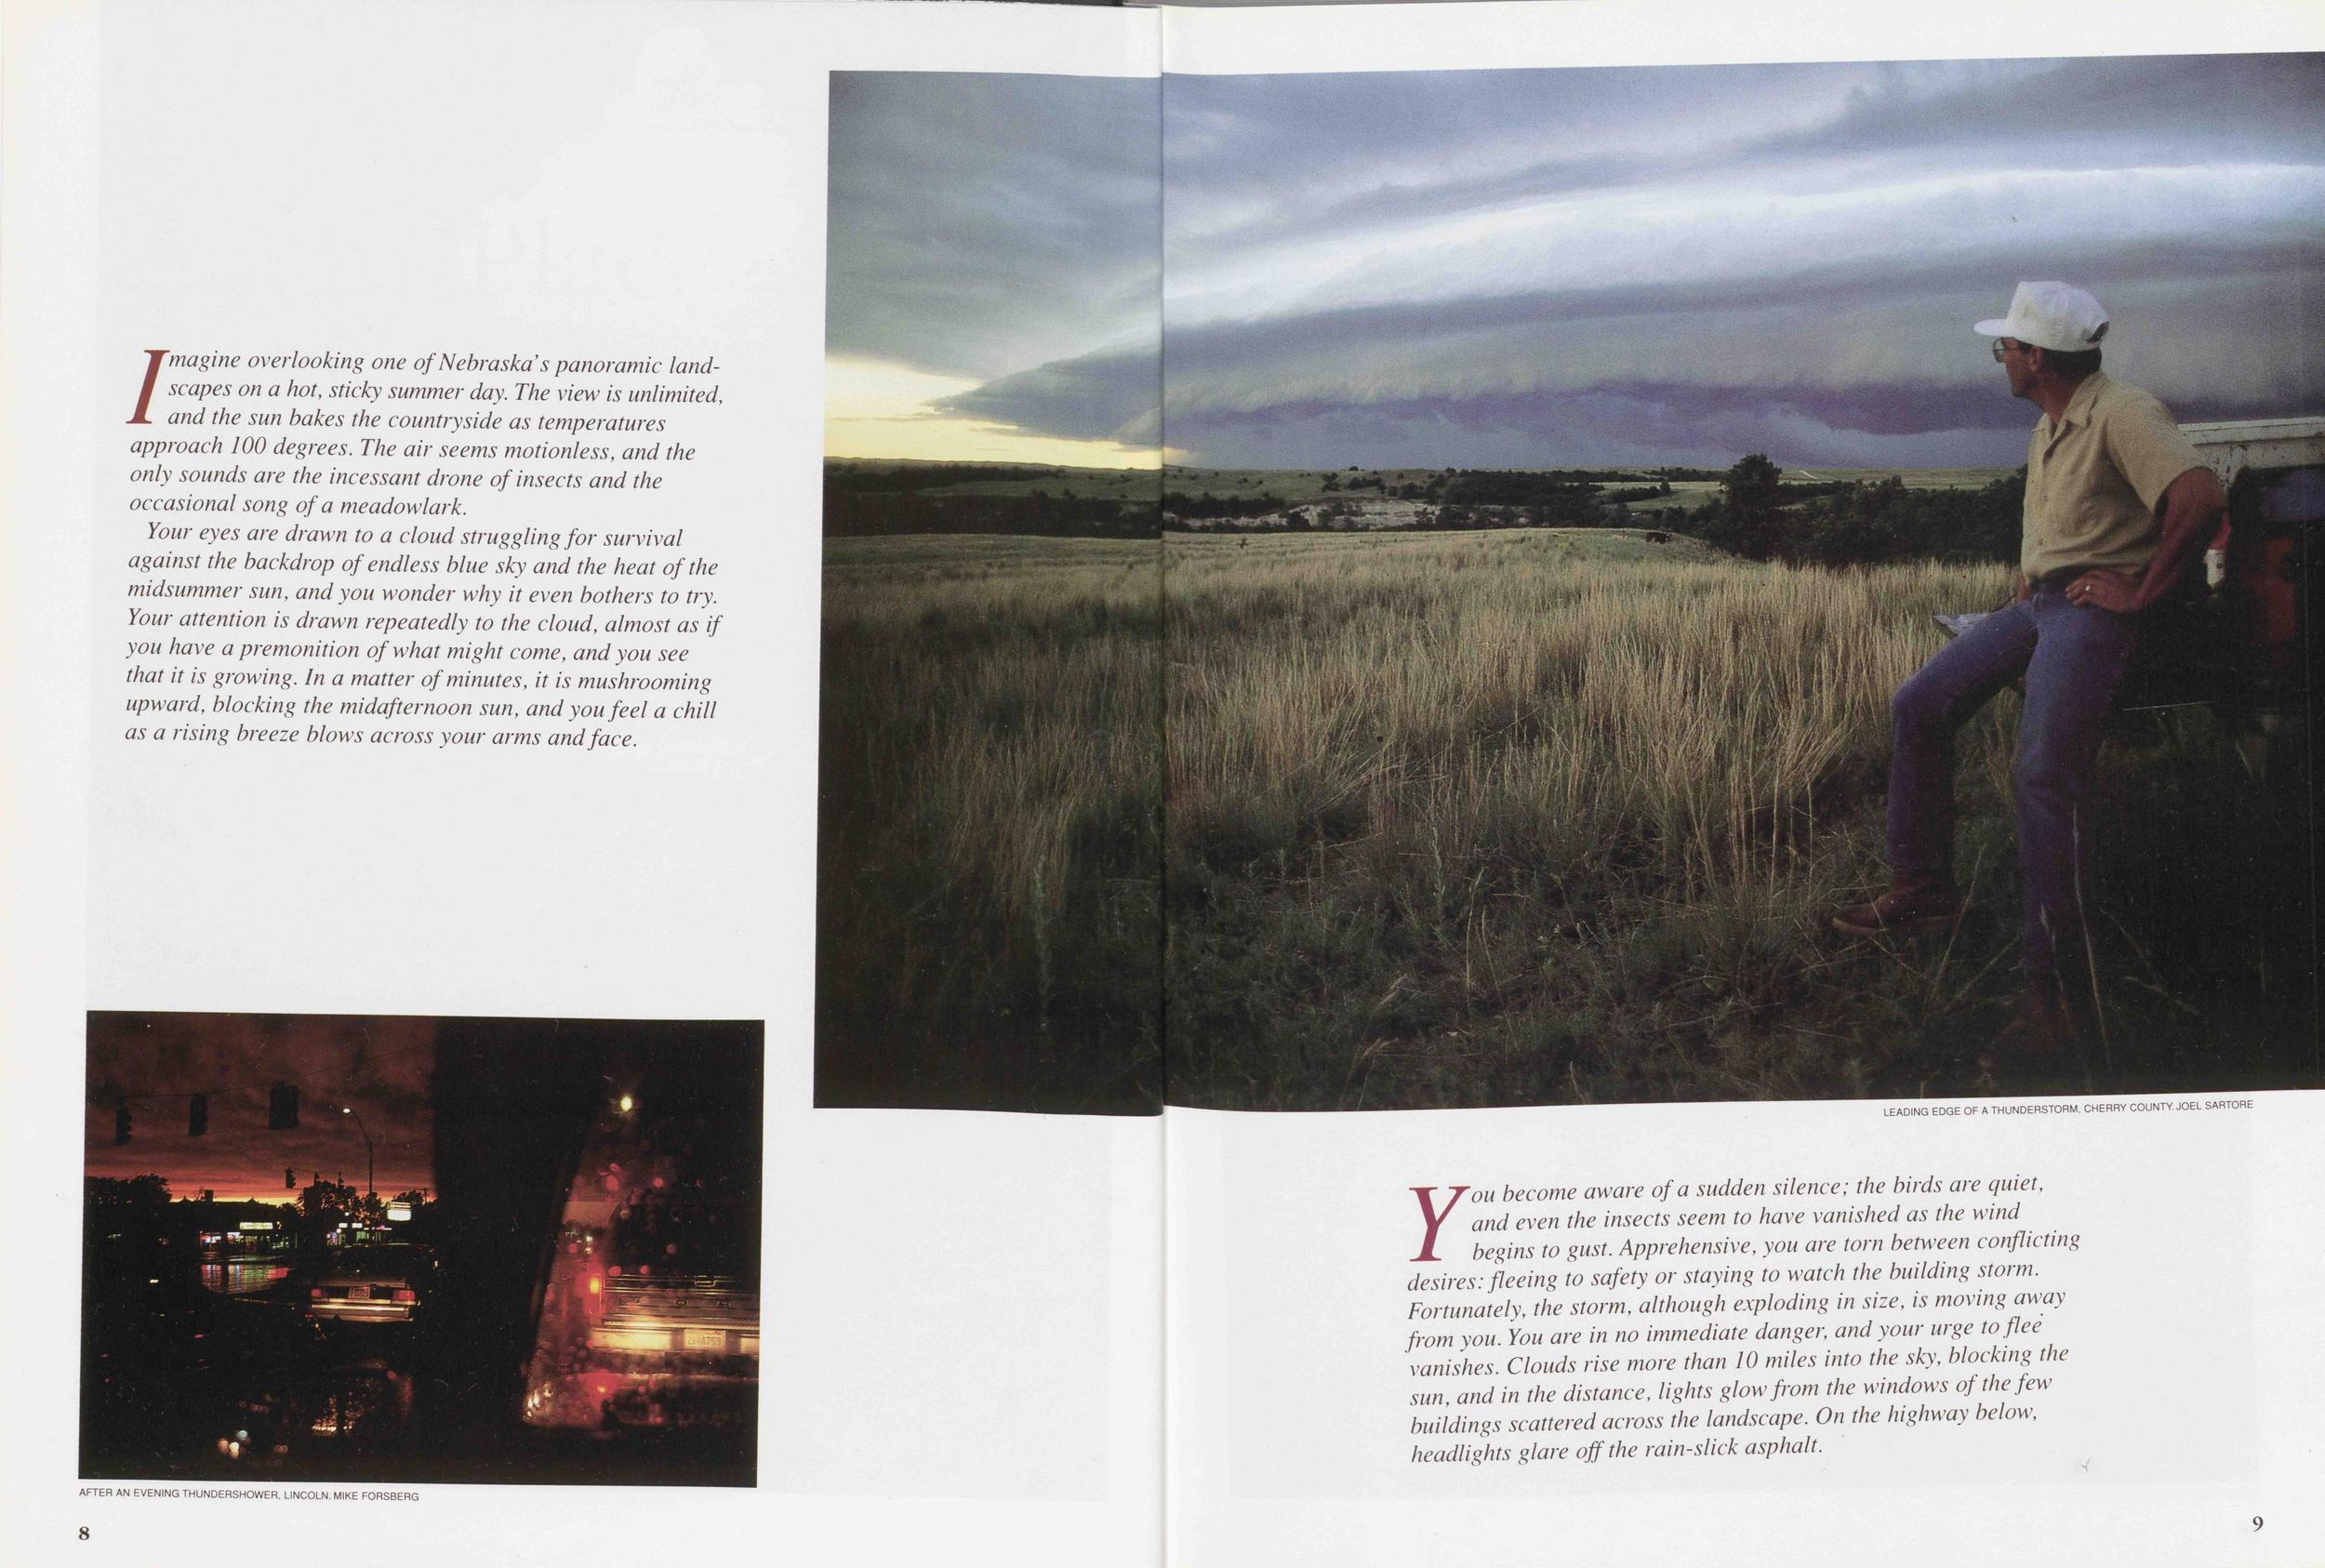
Imagine overlooking one of Nebraska s panoramic landscapes on a hot, sticky summer day. The view is unlimited, and the sun bakes the countryside as temperatures approach 100 degrees. The air seems motionless, and the only sounds are the incessant drone of insects and the occasional song of a meadowlark.
Your eyes are drawn to a cloud struggling for survival against the backdrop of endless blue sky and the heat of the midsummer sun, and you wonder why it even bothers to try. Your attention is drawn repeatedly to the cloud, almost as if you have a premonition of what might come, and you see that it is growing. In a matter of minutes, it is mushrooming upward, blocking the midafternoon sun, and you feel a chill as a rising breeze blows across your arms and face.
rou become aware of a sudden silence; the birds are quiet, and even the insects seem to have vanished as the wind begins to gust. Apprehensive, you are torn between conflicting desires: fleeing to safety or staying to watch the building storm. Fortunately, the storm, although exploding in size, is moving away from you. You are in no immediate danger, and your urge to flee vanishes. Clouds rise more than 10 miles into the sky, blocking the sun, and in the distance, lights glow from the windows of the few buildings scattered across the landscape. On the highway below, headlights glare off the rain-slick asphalt.
9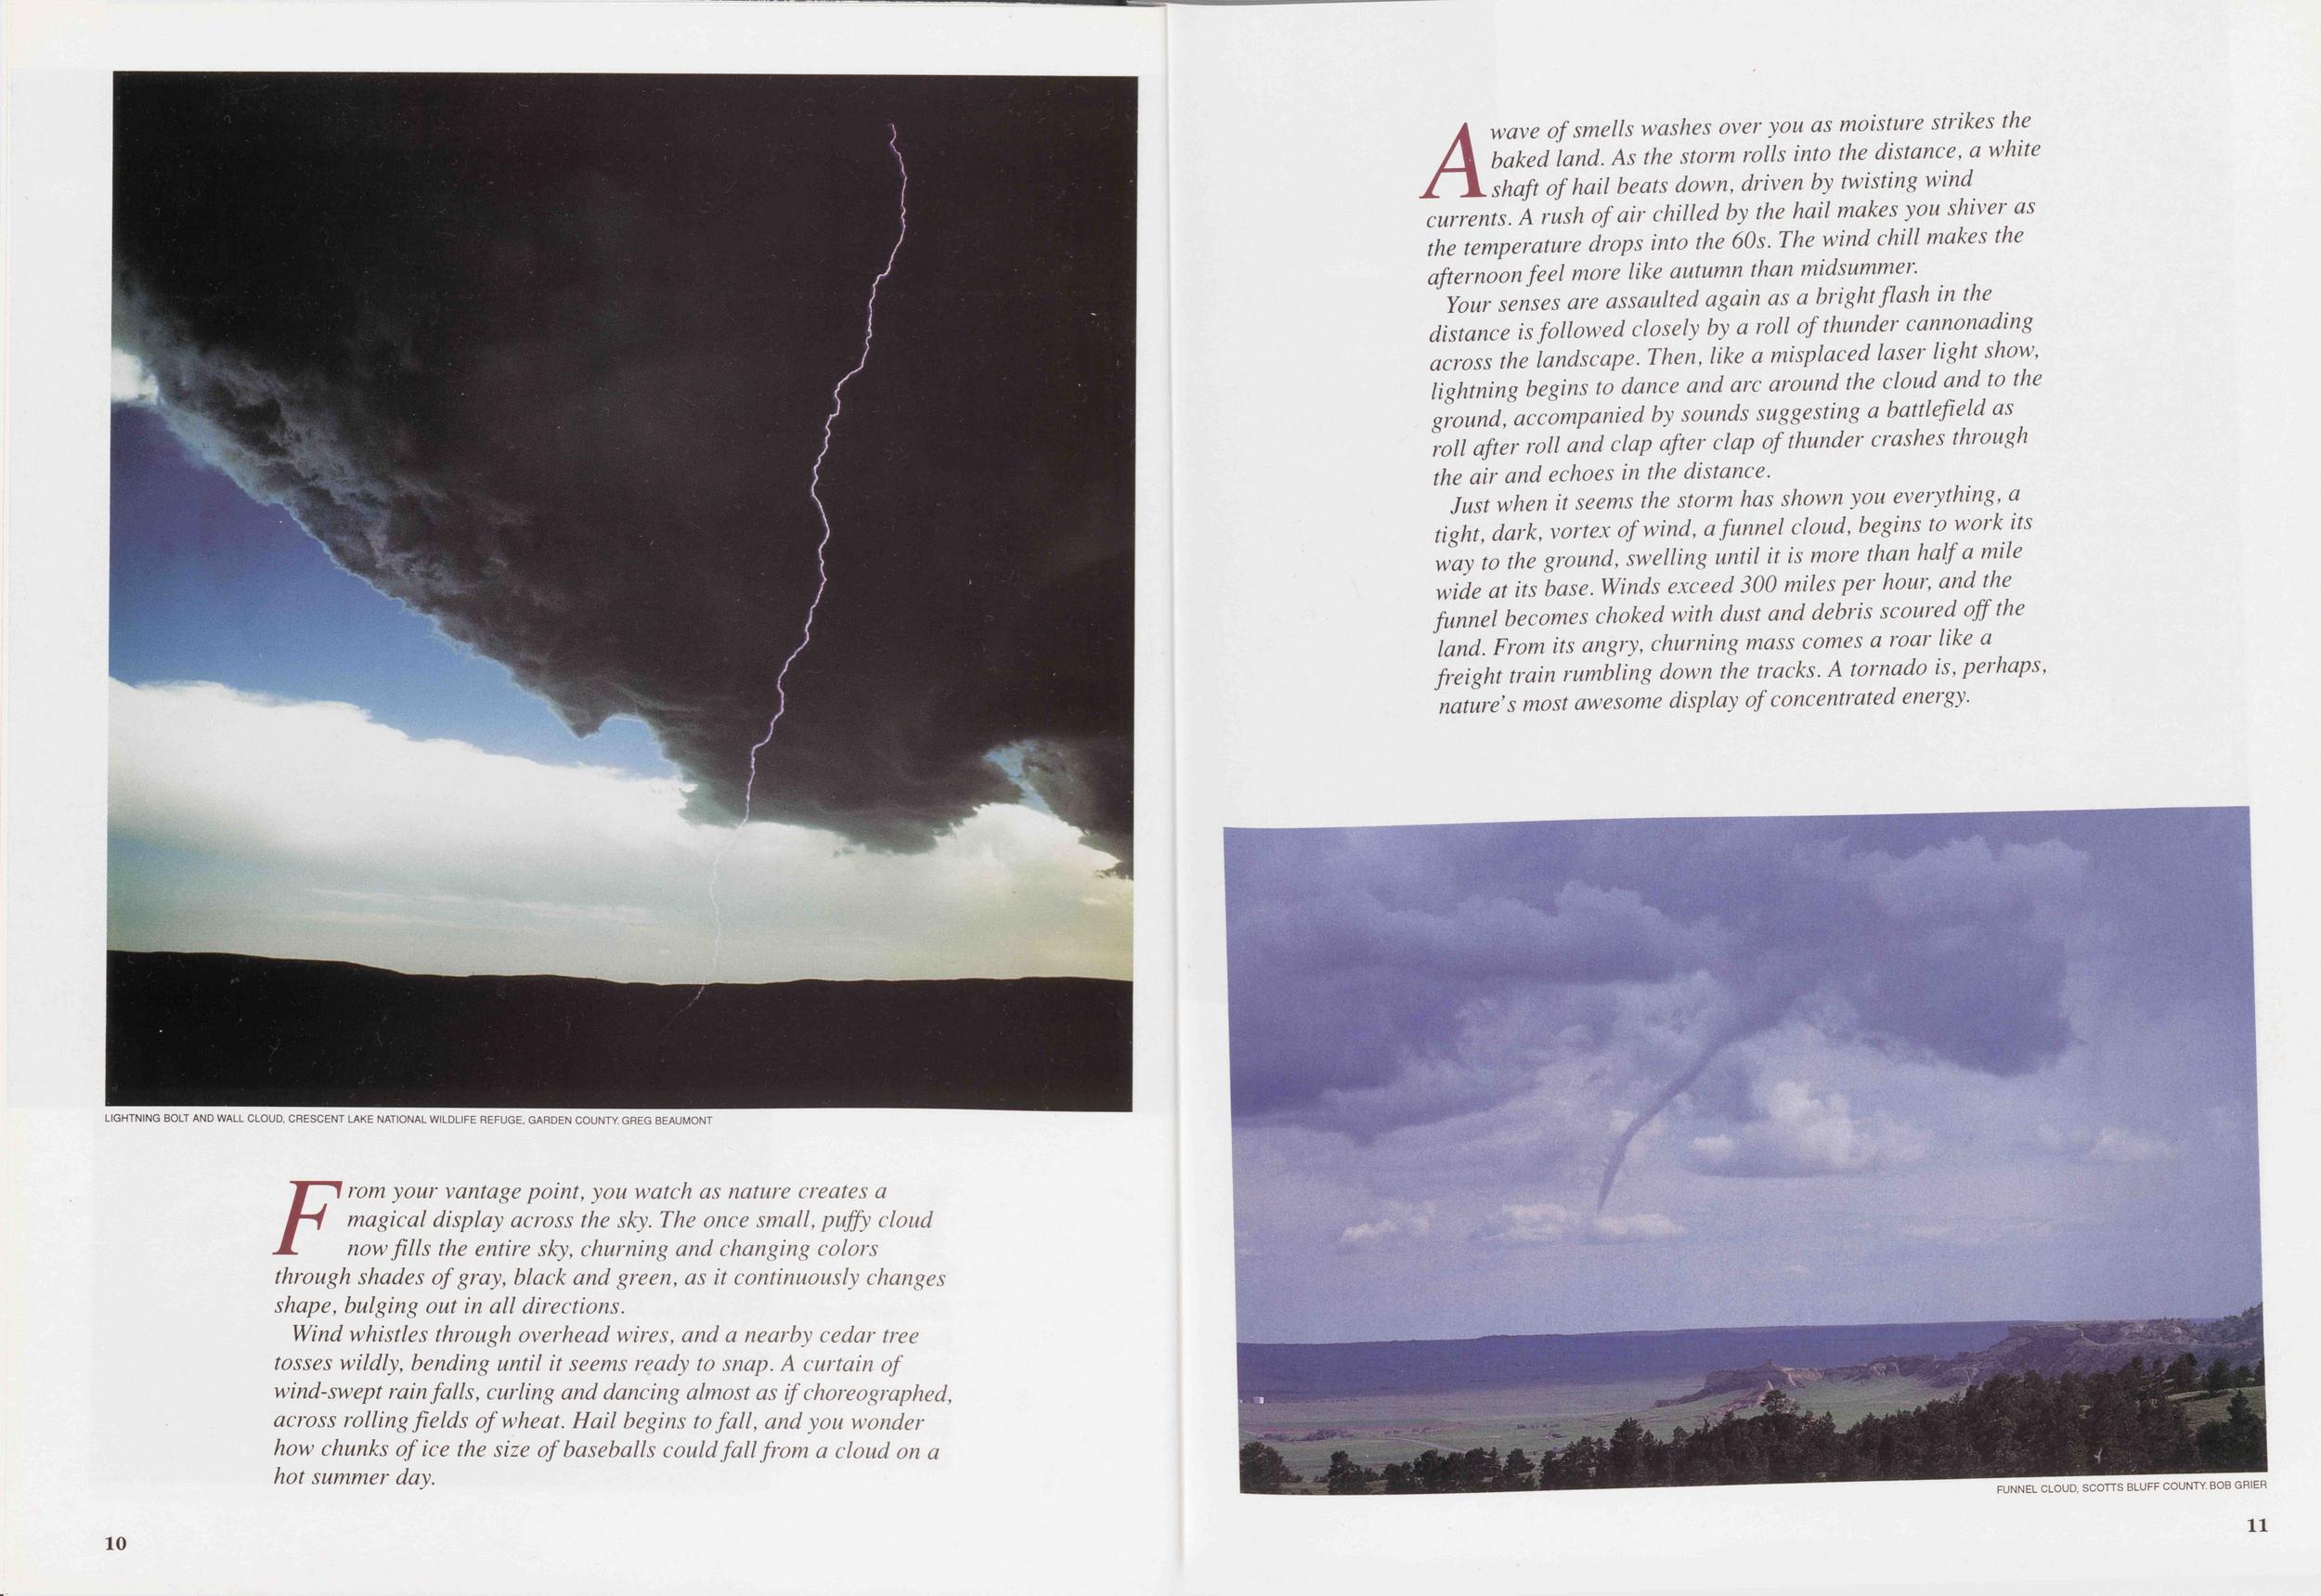
m l rom your vantage point, you watch as nature creates a #"Y magical display across the sky. The once small, puffy cloud X. now fills the entire sky, churning and changing colors through shades of gray, black and green, as it continuously changes shape, bulging out in all directions.
Wind whistles through overhead wires, and a nearby cedar tree tosses wildly, bending until it seems ready to snap. A curtain of wind-swept rainfalls, curling and dancing almost as if choreographed, across rolling fields of wheat. Hail begins to fall, and you wonder how chunks of ice the size of baseballs could fall from a cloud on a hot summer day.
10A wave of smells washes over you as moisture strikes the baked land. As the storm rolls into the distance, a white shaft of hail beats down, driven by twisting wind currents. A rush of air chilled by the hail makes you shiver as the temperature drops into the 60s. The wind chill makes the afternoon feel more like autumn than midsummer.
Your senses are assaulted again as a bright flash in the distance is followed closely by a roll of thunder cannonading across the landscape. Then, like a misplaced laser light show, lightning begins to dance and arc around the cloud and to the ground, accompanied by sounds suggesting a battlefield as roll after roll and clap after clap of thunder crashes through the air and echoes in the distance.
Just when it seems the storm has shown you everything, a tight, dark, vortex of wind, a funnel cloud, begins to work its way to the ground, swelling until it is more than half a mile wide at its base. Winds exceed 300 miles per hour, and the funnel becomes choked with dust and debris scoured off the land. From its angry, churning mass comes a roar like a freight train rumbling down the tracks. A tornado is, perhaps, nature s most awesome display of concentrated energy.
"Nature seems completely out of control. Fear and a I'll rush of adrenaline make your heart beat faster as the storm plays out its symphony in front of you.
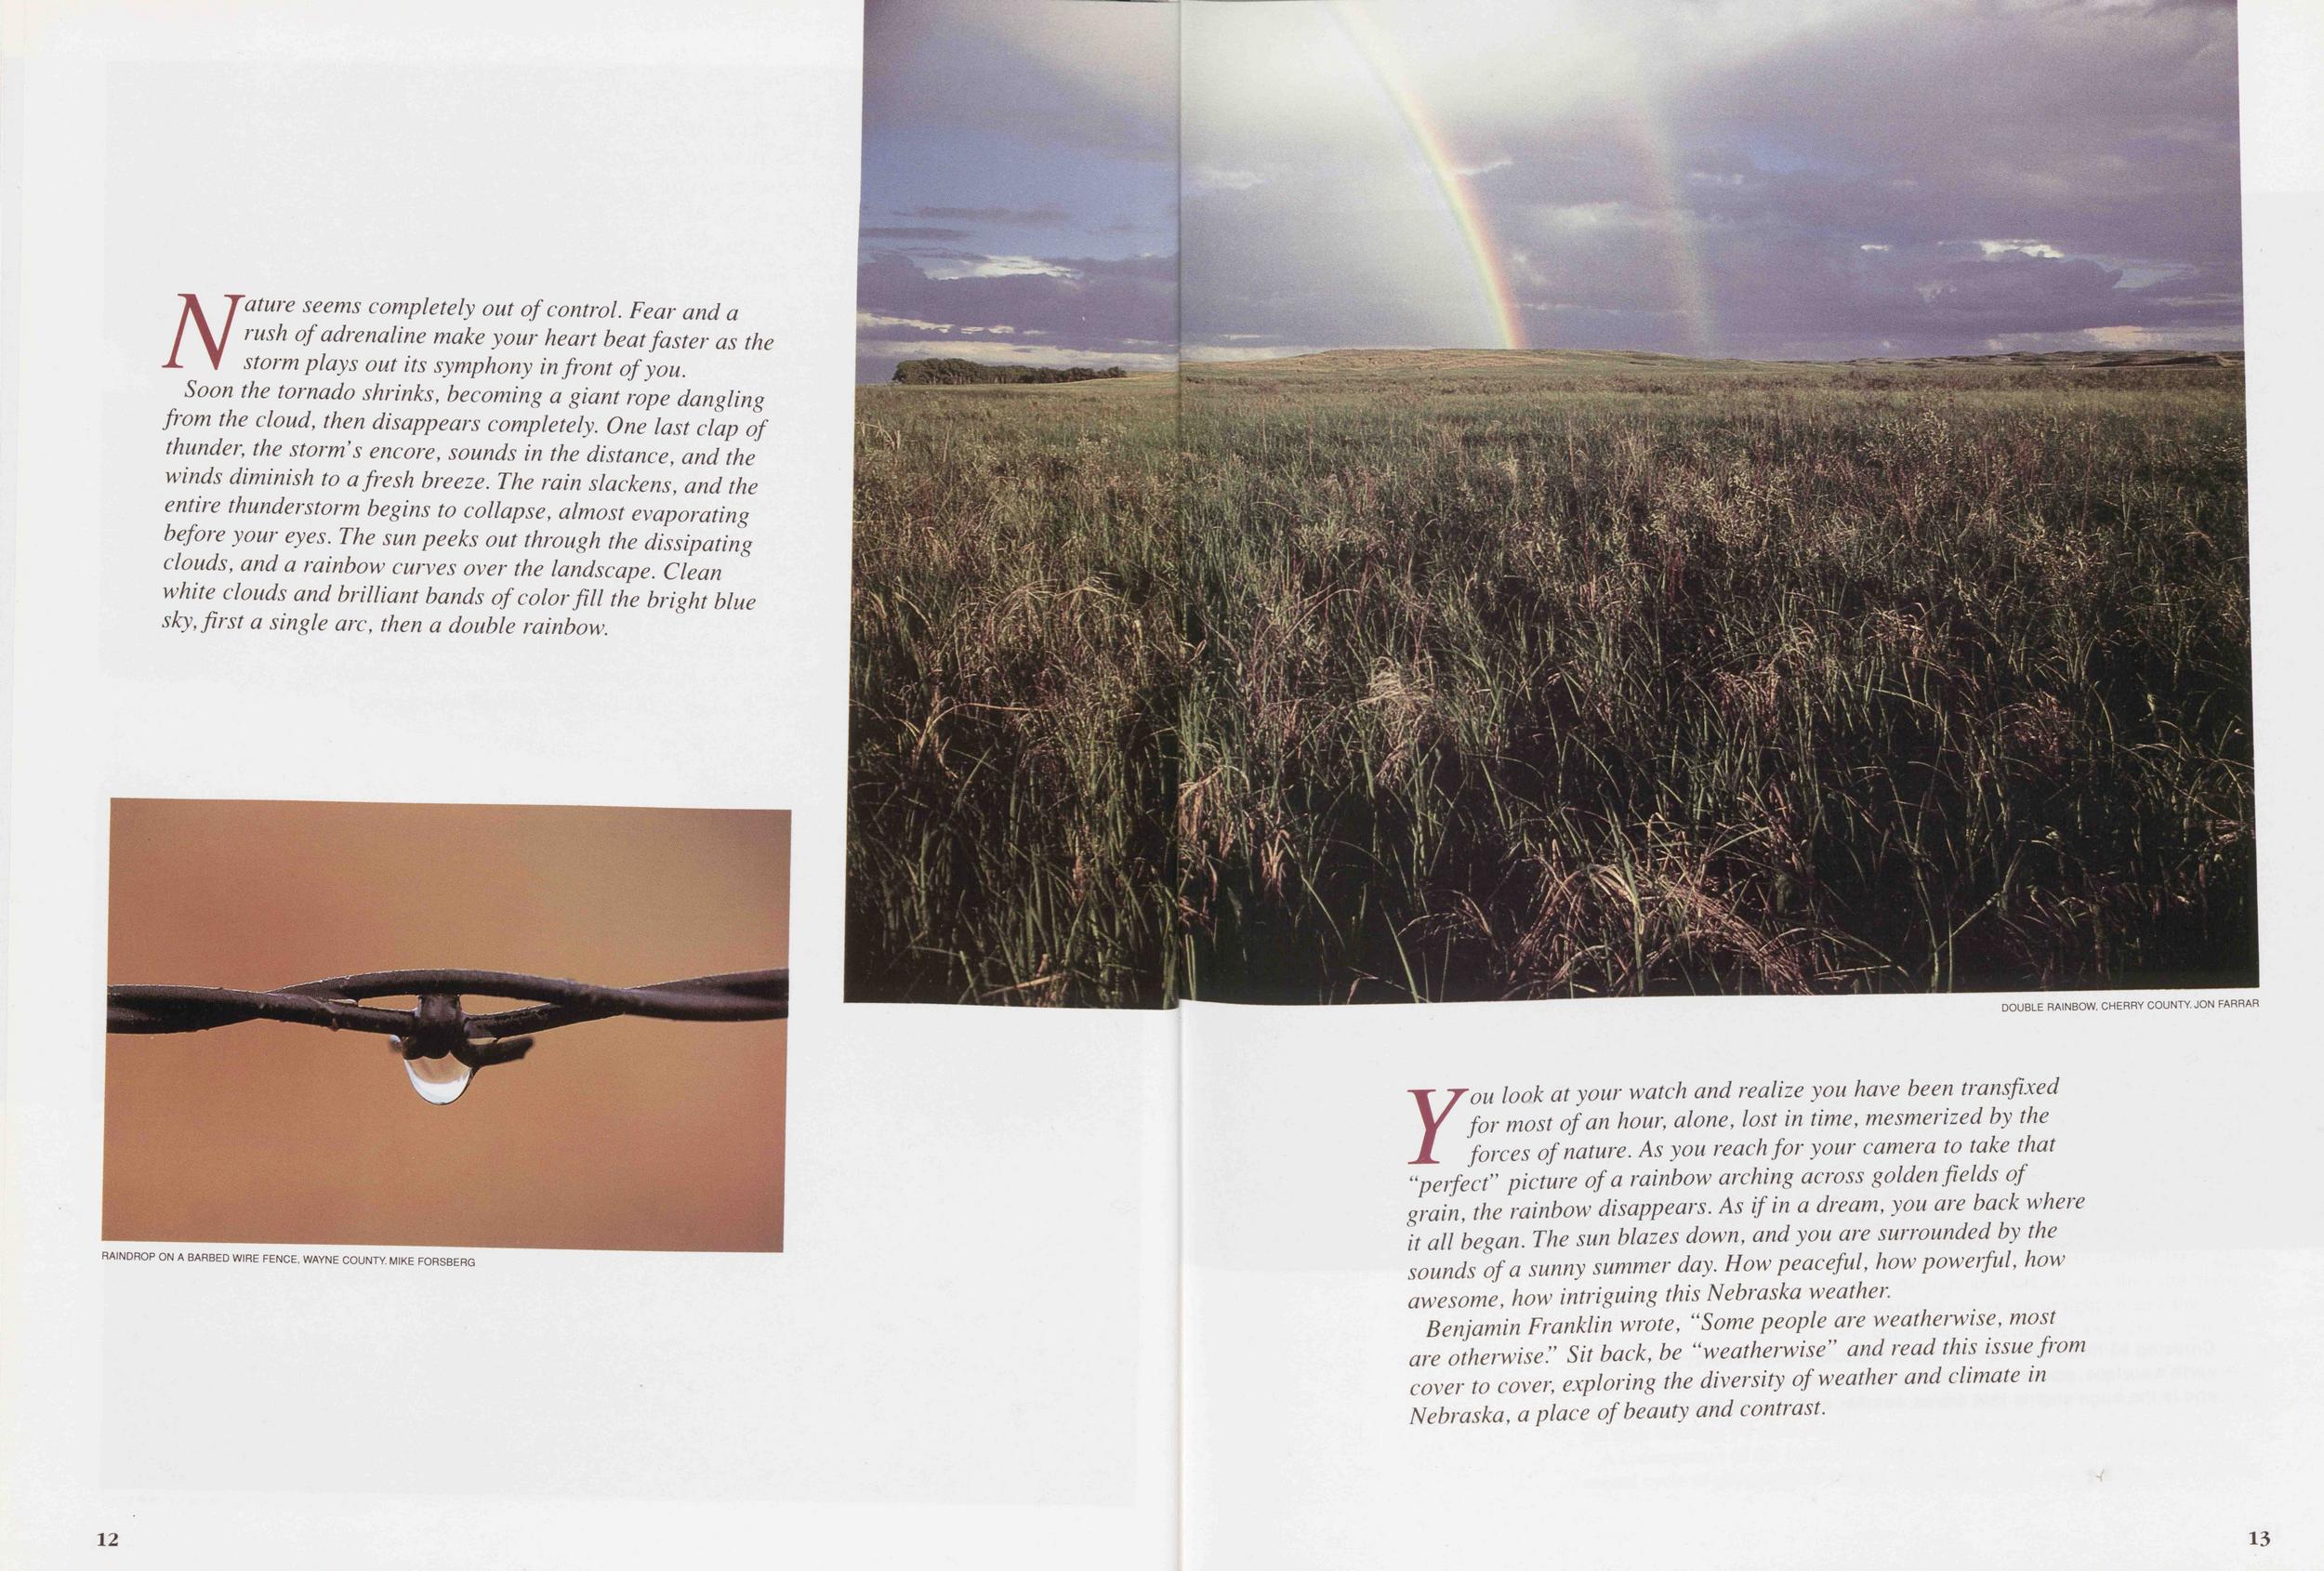
Soon the tornado shrinks, becoming a giant rope dangling from the cloud, then disappears completely. One last clap of thunder, the storm's encore, sounds in the distance, and the winds diminish to afresh breeze. The rain slackens, and the entire thunderstorm begins to collapse, almost evaporating before your eyes. The sun peeks out through the dissipating clouds, and a rainbow curves over the landscape. Clean white clouds and brilliant bands of color fill the bright blue sky, first a single arc, then a double rainbow.
F'ou look at your watch and realize you have been transfixed for most of an hour, alone, lost in time, mesmerized by the forces of nature. As you reach for your camera to take that "perfect" picture of a rainbow arching across golden fields of grain, the rainbow disappears. As if in a dream, you are back where it all began. The sun blazes down, and you are surrounded by the sounds of a sunny summer day. How peaceful, how powerful, how awesome, how intriguing this Nebraska weather.
Benjamin Franklin wrote, "Some people are weatherwise, most are otherwise!' Sit back, be "weatherwise" and read this issue from cover to cover, exploring the diversity of weather and climate in Nebraska, a place of beauty and contrast
13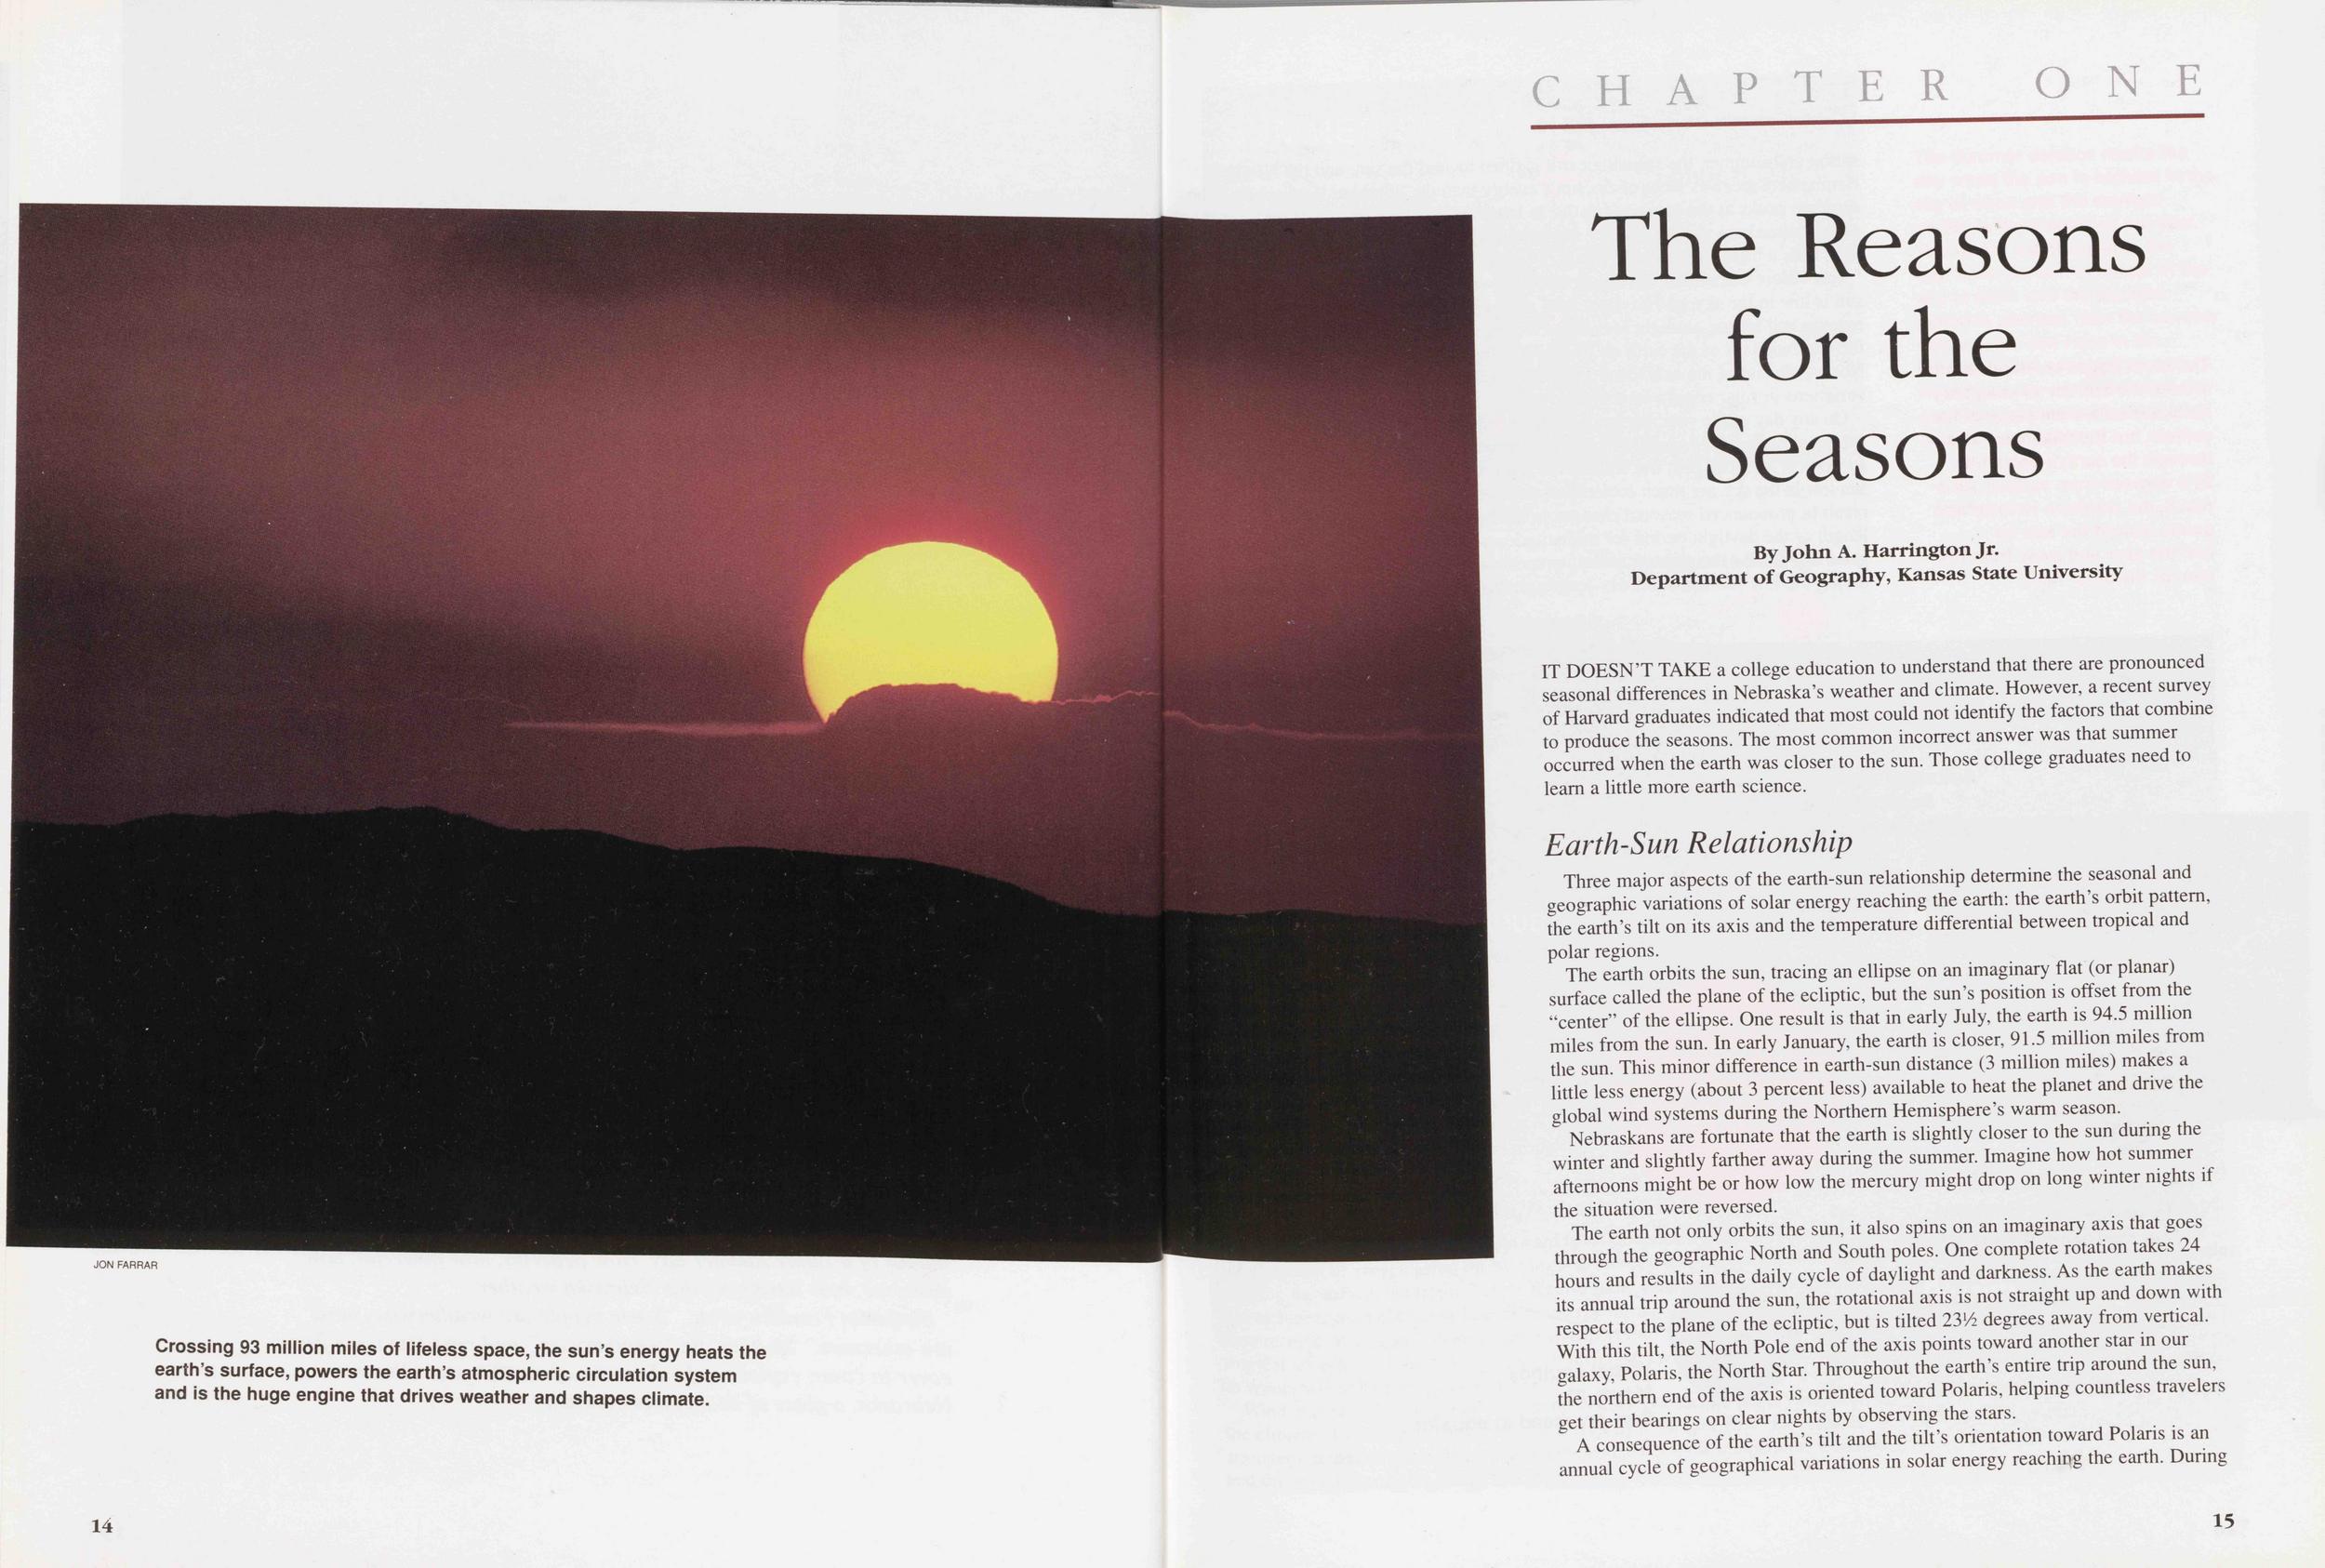
The Reasons for the Seasons
By John A. Harrington Jr. Department of Geography, Kansas State UniversityIT DOESN'T TAKE a college education to understand that there are pronounced seasonal differences in Nebraska's weather and climate. However, a recent survey of Harvard graduates indicated that most could not identify the factors that combine to produce the seasons. The most common incorrect answer was that summer occurred when the earth was closer to the sun. Those college graduates need to learn a little more earth science.
Earth-Sun RelationshipThree major aspects of the earth-sun relationship determine the seasonal and geographic variations of solar energy reaching the earth: the earth's orbit pattern, the earth's tilt on its axis and the temperature differential between tropical and polar regions.
The earth orbits the sun, tracing an ellipse on an imaginary flat (or planar) surface called the plane of the ecliptic, but the sun's position is offset from the "center" of the ellipse. One result is that in early July, the earth is 94.5 million miles from the sun. In early January, the earth is closer, 91.5 million miles from the sun. This minor difference in earth-sun distance (3 million miles) makes a little less energy (about 3 percent less) available to heat the planet and drive the global wind systems during the Northern Hemisphere's warm season.
Nebraskans are fortunate that the earth is slightly closer to the sun during the winter and slightly farther away during the summer. Imagine how hot summer afternoons might be or how low the mercury might drop on long winter nights if the situation were reversed.
The earth not only orbits the sun, it also spins on an imaginary axis that goes through the geographic North and South poles. One complete rotation takes 24 hours and results in the daily cycle of daylight and darkness. As the earth makes its annual trip around the sun, the rotational axis is not straight up and down with respect to the plane of the ecliptic, but is tilted 23l/2 degrees away from vertical. With this tilt, the North Pole end of the axis points toward another star in our galaxy, Polaris, the North Star. Throughout the earth's entire trip around the sun, the northern end of the axis is oriented toward Polaris, helping countless travelers get their bearings on clear nights by observing the stars.
A consequence of the earth's tilt and the tilt's orientation toward Polaris is an annual cycle of geographical variations in solar energy reaching the earth. During 15 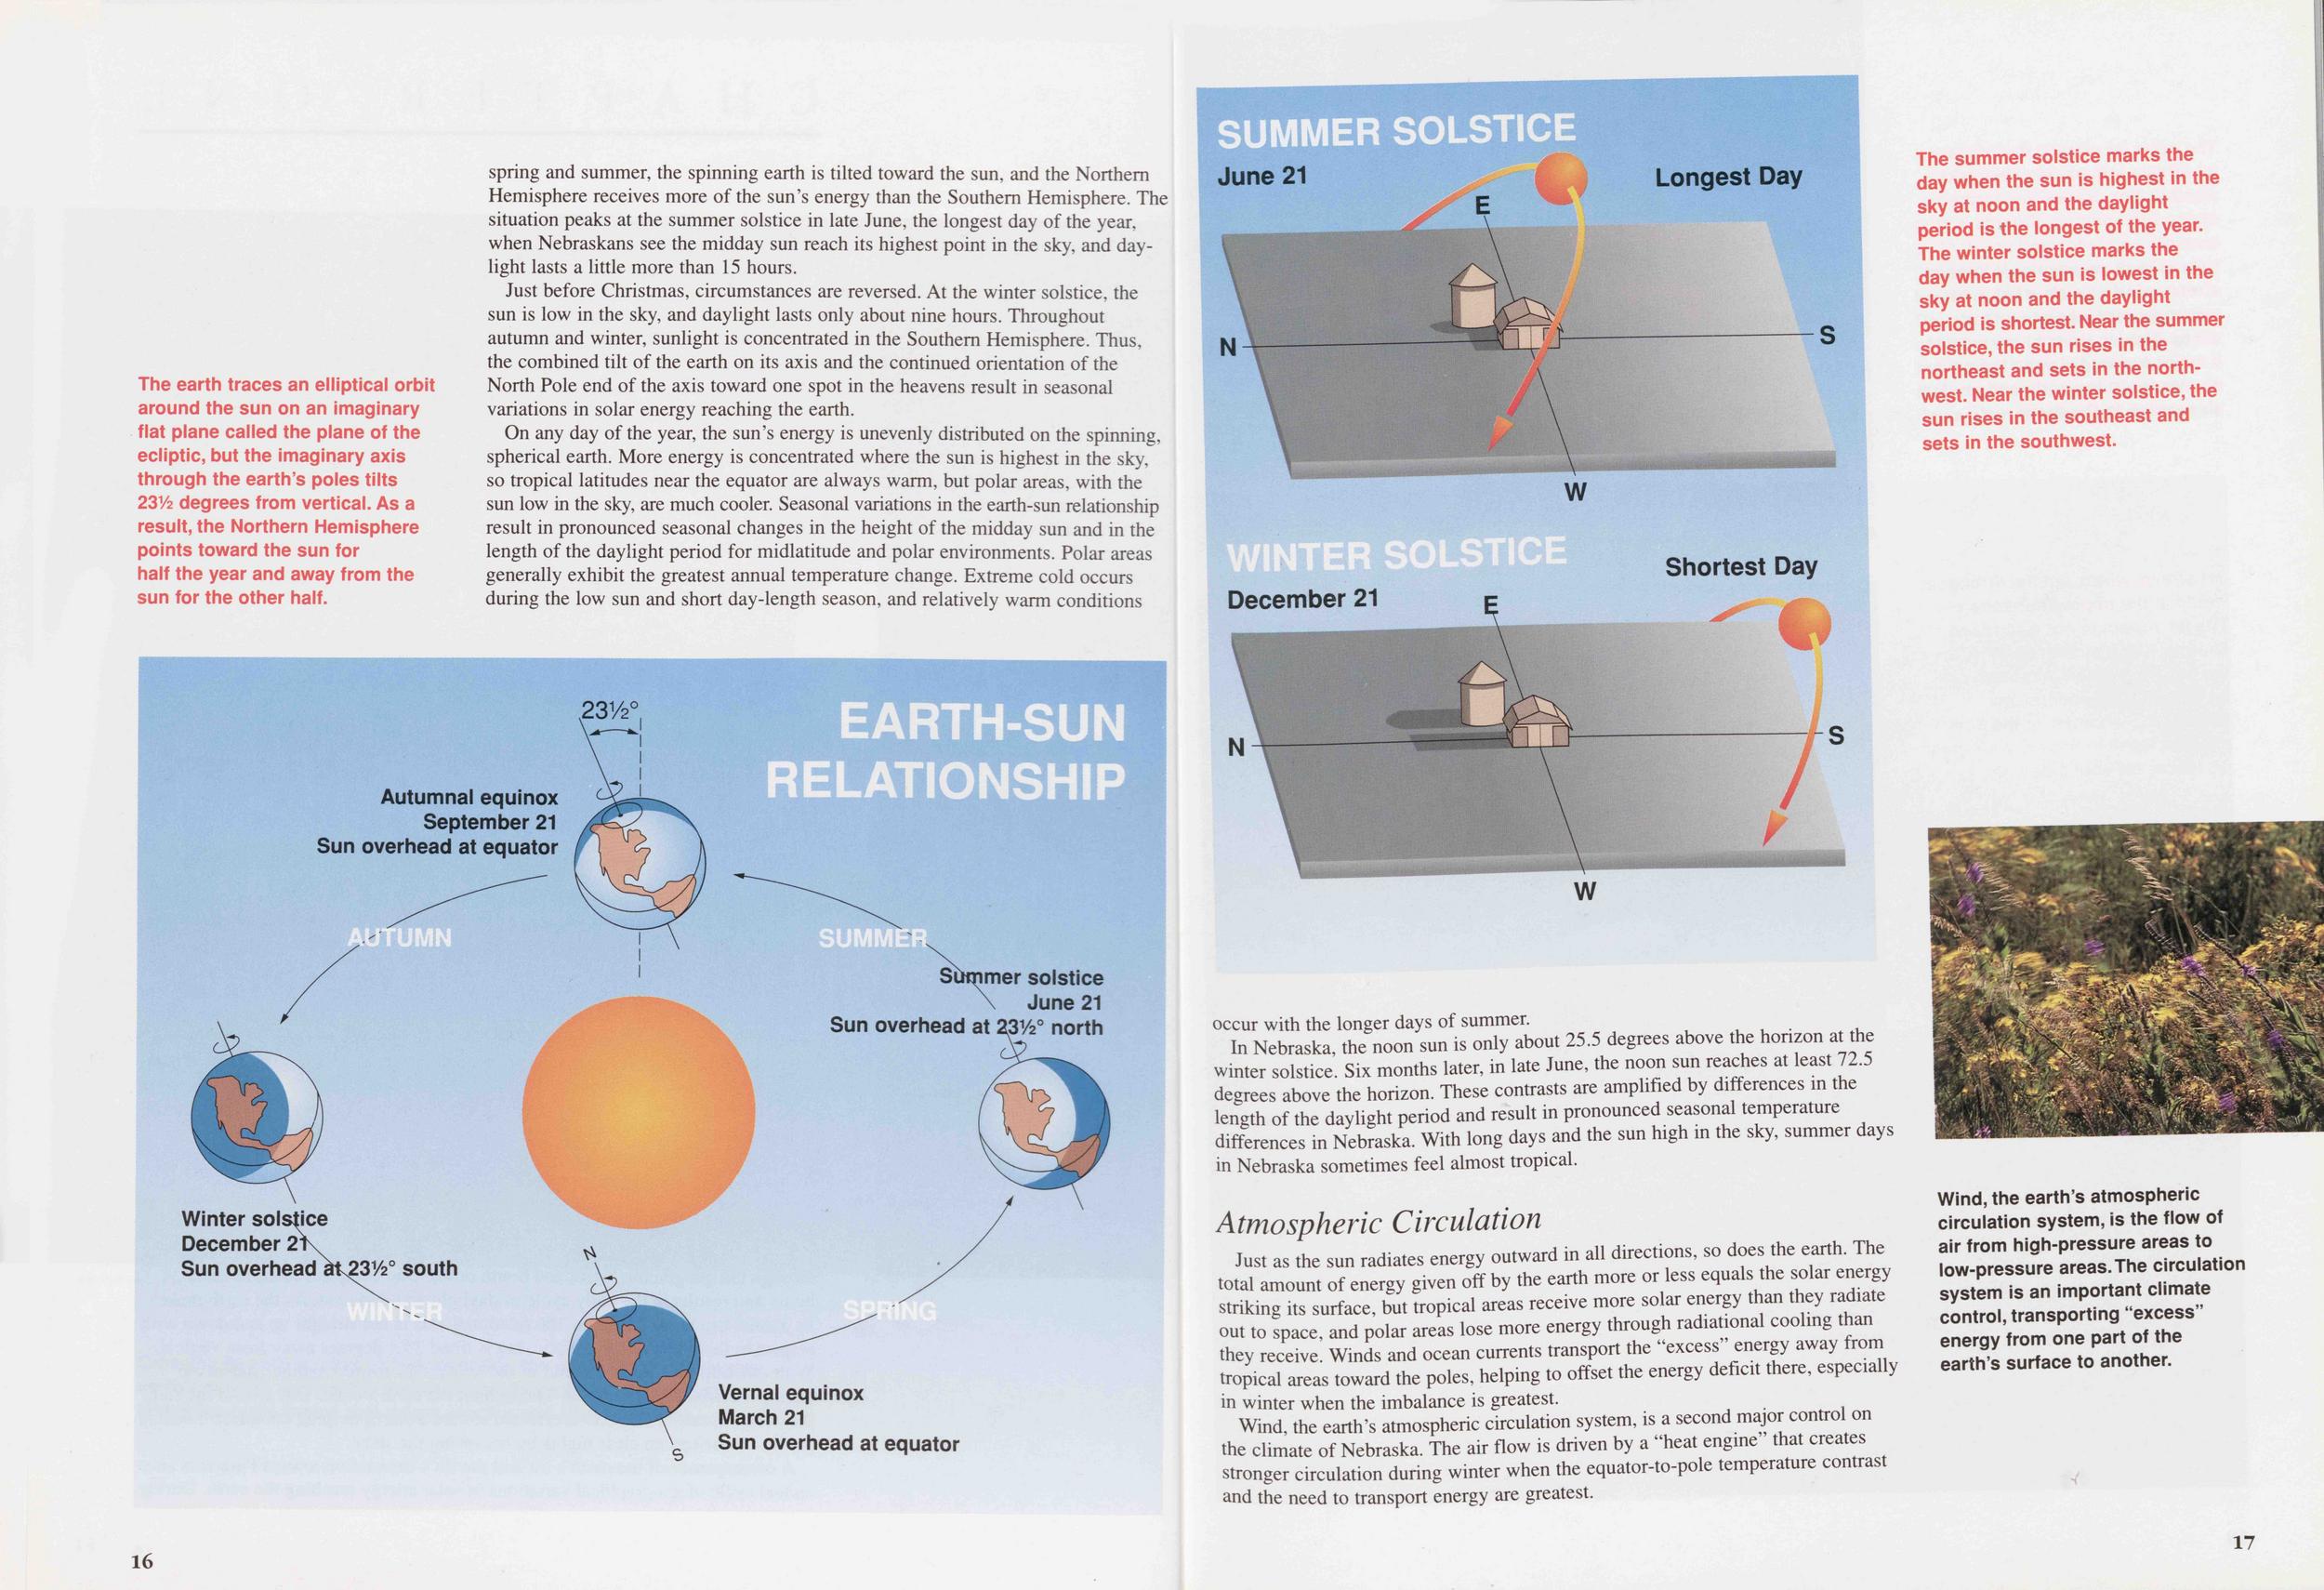
Just before Christmas, circumstances are reversed. At the winter solstice, the sun is low in the sky, and daylight lasts only about nine hours. Throughout autumn and winter, sunlight is concentrated in the Southern Hemisphere. Thus, the combined tilt of the earth on its axis and the continued orientation of the North Pole end of the axis toward one spot in the heavens result in seasonal variations in solar energy reaching the earth.
On any day of the year, the sun's energy is unevenly distributed on the spinning, spherical earth. More energy is concentrated where the sun is highest in the sky, so tropical latitudes near the equator are always warm, but polar areas, with the sun low in the sky, are much cooler. Seasonal variations in the earth-sun relationship result in pronounced seasonal changes in the height of the midday sun and in the length of the daylight period for midlatitude and polar environments. Polar areas generally exhibit the greatest annual temperature change. Extreme cold occurs during the low sun and short day-length season, and relatively warm conditions 16 occur with the longer days of summer.
In Nebraska, the noon sun is only about 25.5 degrees above the horizon at the winter solstice. Six months later, in late June, the noon sun reaches at least 72.5 degrees above the horizon. These contrasts are amplified by differences in the length of the daylight period and result in pronounced seasonal temperature differences in Nebraska. With long days and the sun high in the sky, summer days in Nebraska sometimes feel almost tropical.
Atmospheric CirculationJust as the sun radiates energy outward in all directions, so does the earth. The total amount of energy given off by the earth more or less equals the solar energy striking its surface, but tropical areas receive more solar energy than they radiate out to space, and polar areas lose more energy through radiational cooling than they receive. Winds and ocean currents transport the "excess' energy away from tropical areas toward the poles, helping to offset the energy deficit there, especially in winter when the imbalance is greatest.
Wind, the earth's atmospheric circulation system, is a second major control on the climate of Nebraska. The air flow is driven by a "heat engine that creates stronger circulation during winter when the equator-to-pole temperature contrast and the need to transport energy are greatest.
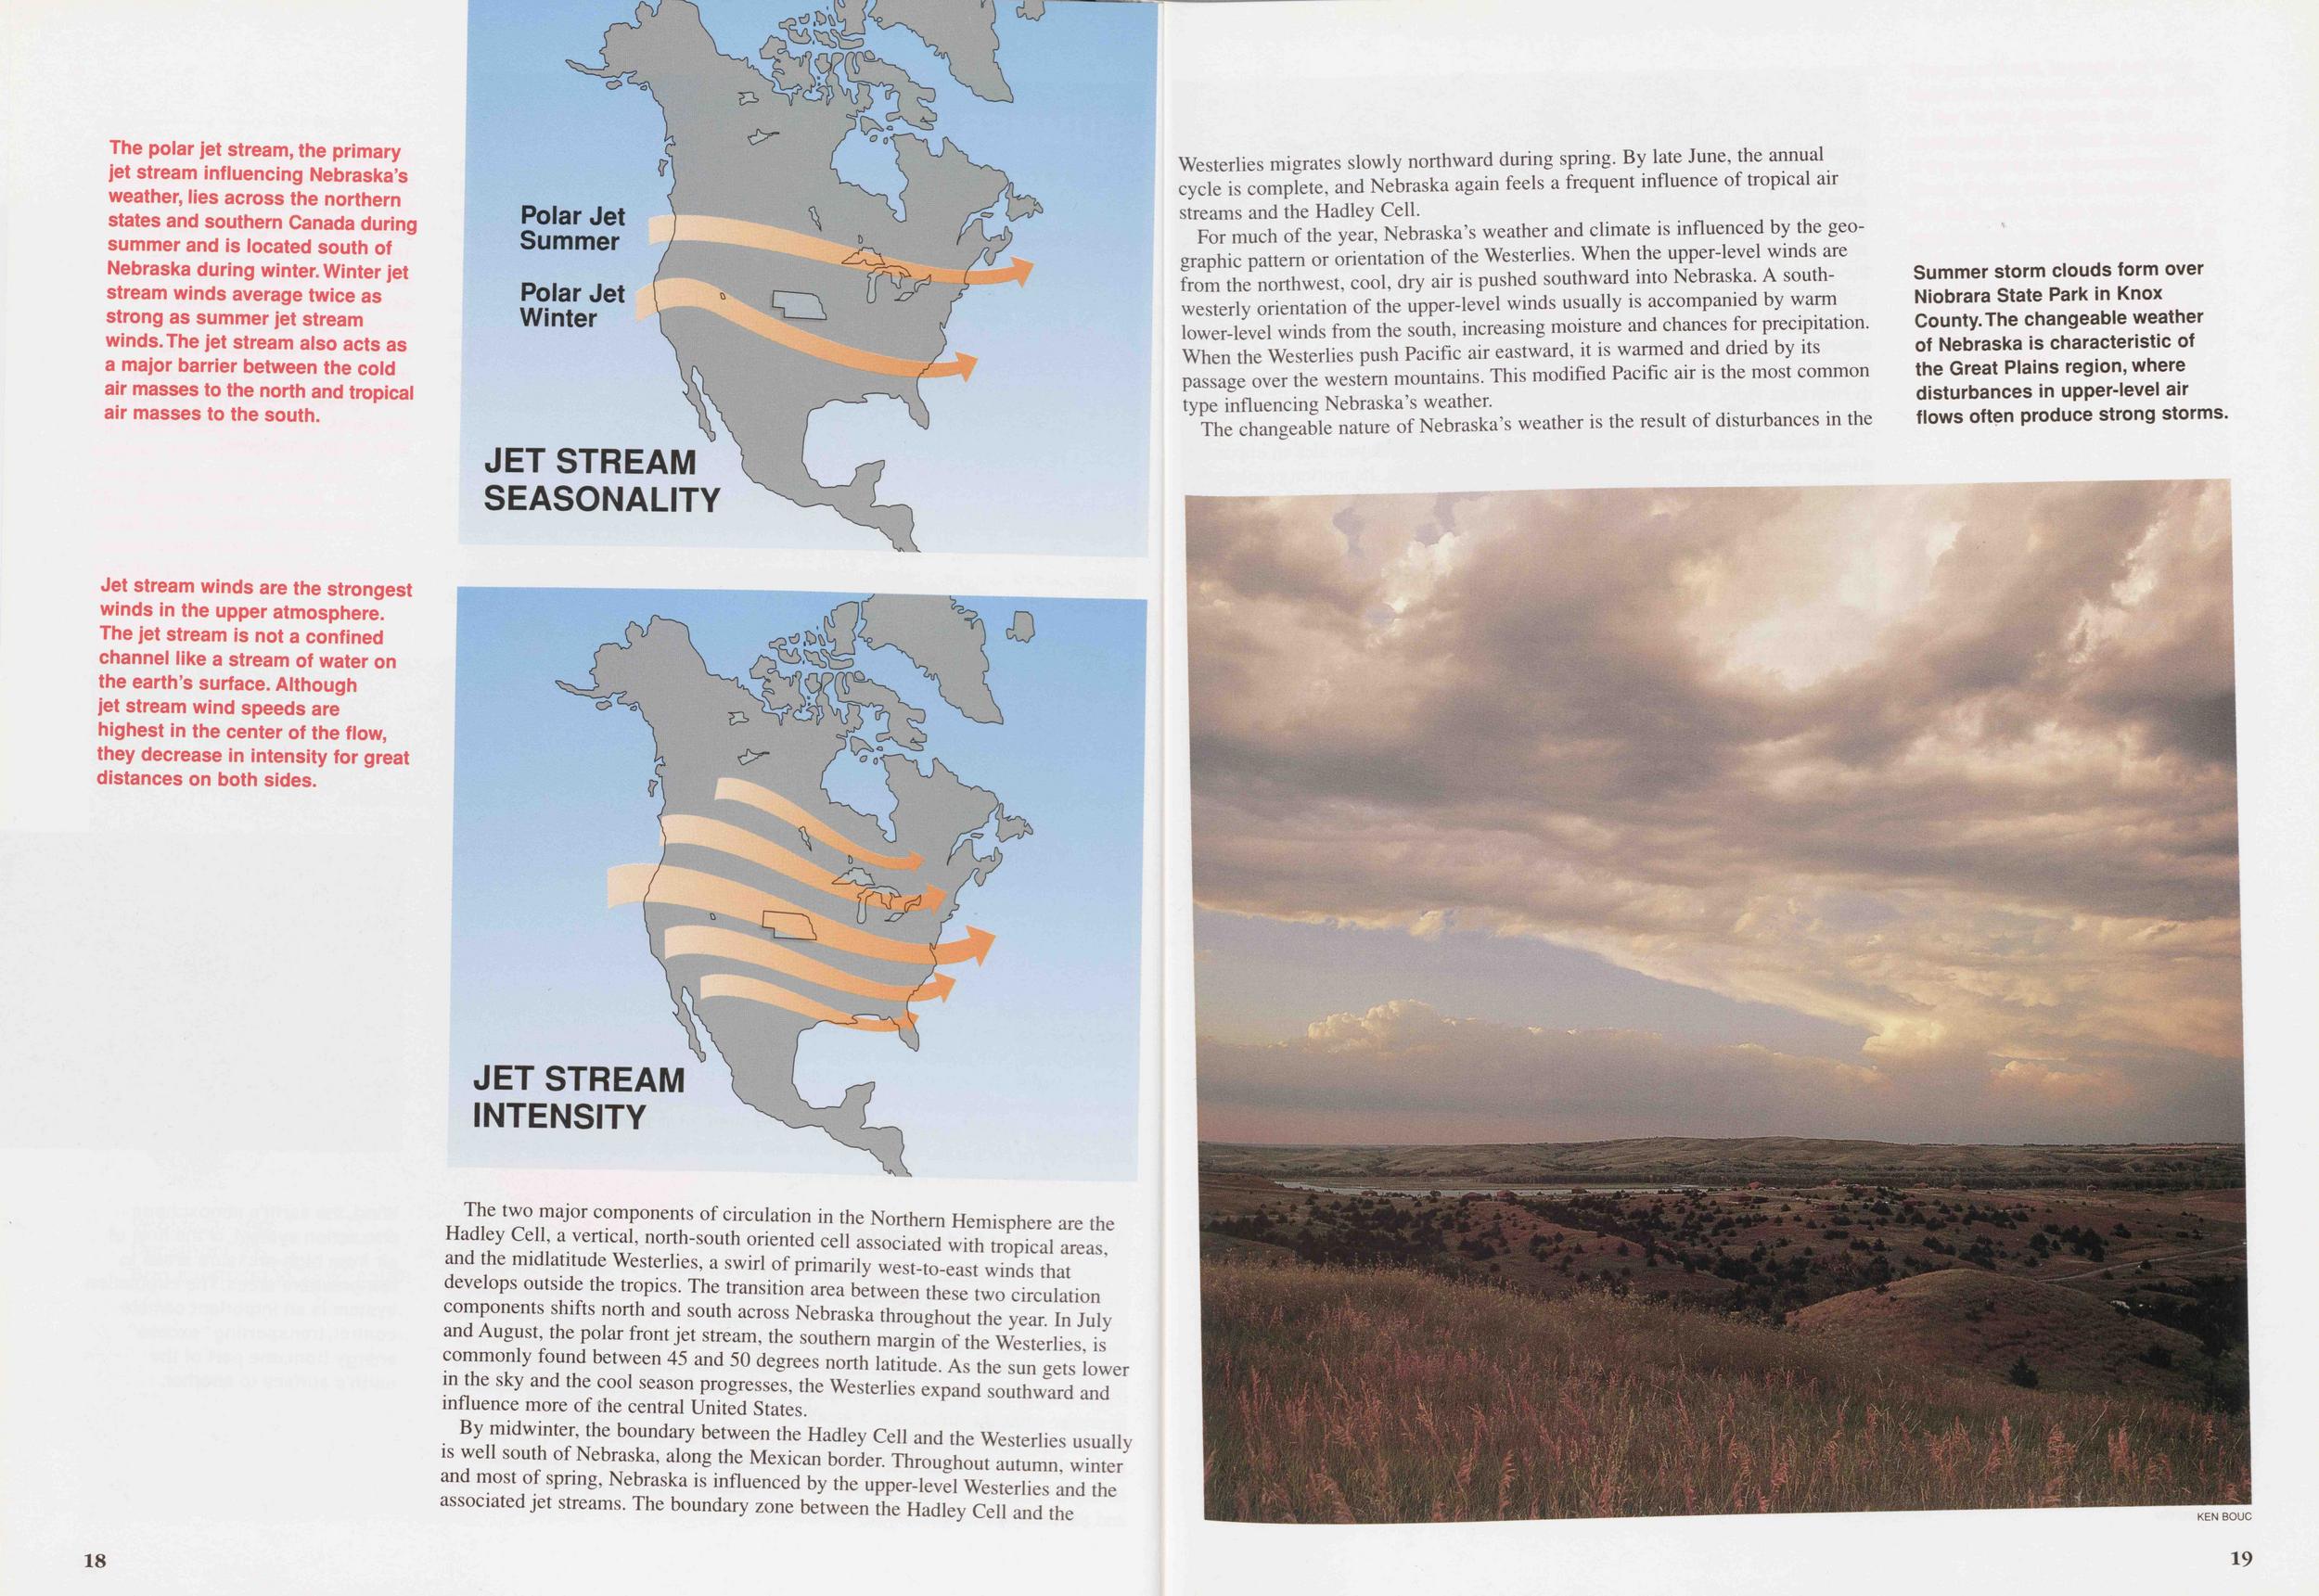
The two major components of circulation in the Northern Hemisphere are the Hadley Cell, a vertical, north-south oriented cell associated with tropical areas, and the midlatitude Westerlies, a swirl of primarily west-to-east winds that develops outside the tropics. The transition area between these two circulation components shifts north and south across Nebraska throughout the year. In July and August, the polar front jet stream, the southern margin of the Westerlies, is commonly found between 45 and 50 degrees north latitude. As the sun gets lower in the sky and the cool season progresses, the Westerlies expand southward and influence more of the central United States.
By midwinter, the boundary between the Hadley Cell and the Westerlies usually is well south of Nebraska, along the Mexican border. Throughout autumn, winter and most of spring, Nebraska is influenced by the upper-level Westerlies and the associated jet streams. The boundary zone between the Hadley Cell and the 18 Westerlies migrates slowly northward during spring. By late June, the annual cycle is complete, and Nebraska again feels a frequent influence of tropical air streams and the Hadley Cell.
For much of the year, Nebraska's weather and climate is influenced by the geographic pattern or orientation of the Westerlies. When the upper-level winds are from the northwest, cool, dry air is pushed southward into Nebraska. A southwesterly orientation of the upper-level winds usually is accompanied by warm lower-level winds from the south, increasing moisture and chances for precipitation. When the Westerlies push Pacific air eastward, it is warmed and dried by its passage over the western mountains. This modified Pacific air is the most common type influencing Nebraska's weather.
The changeable nature of Nebraska's weather is the result of disturbances in the
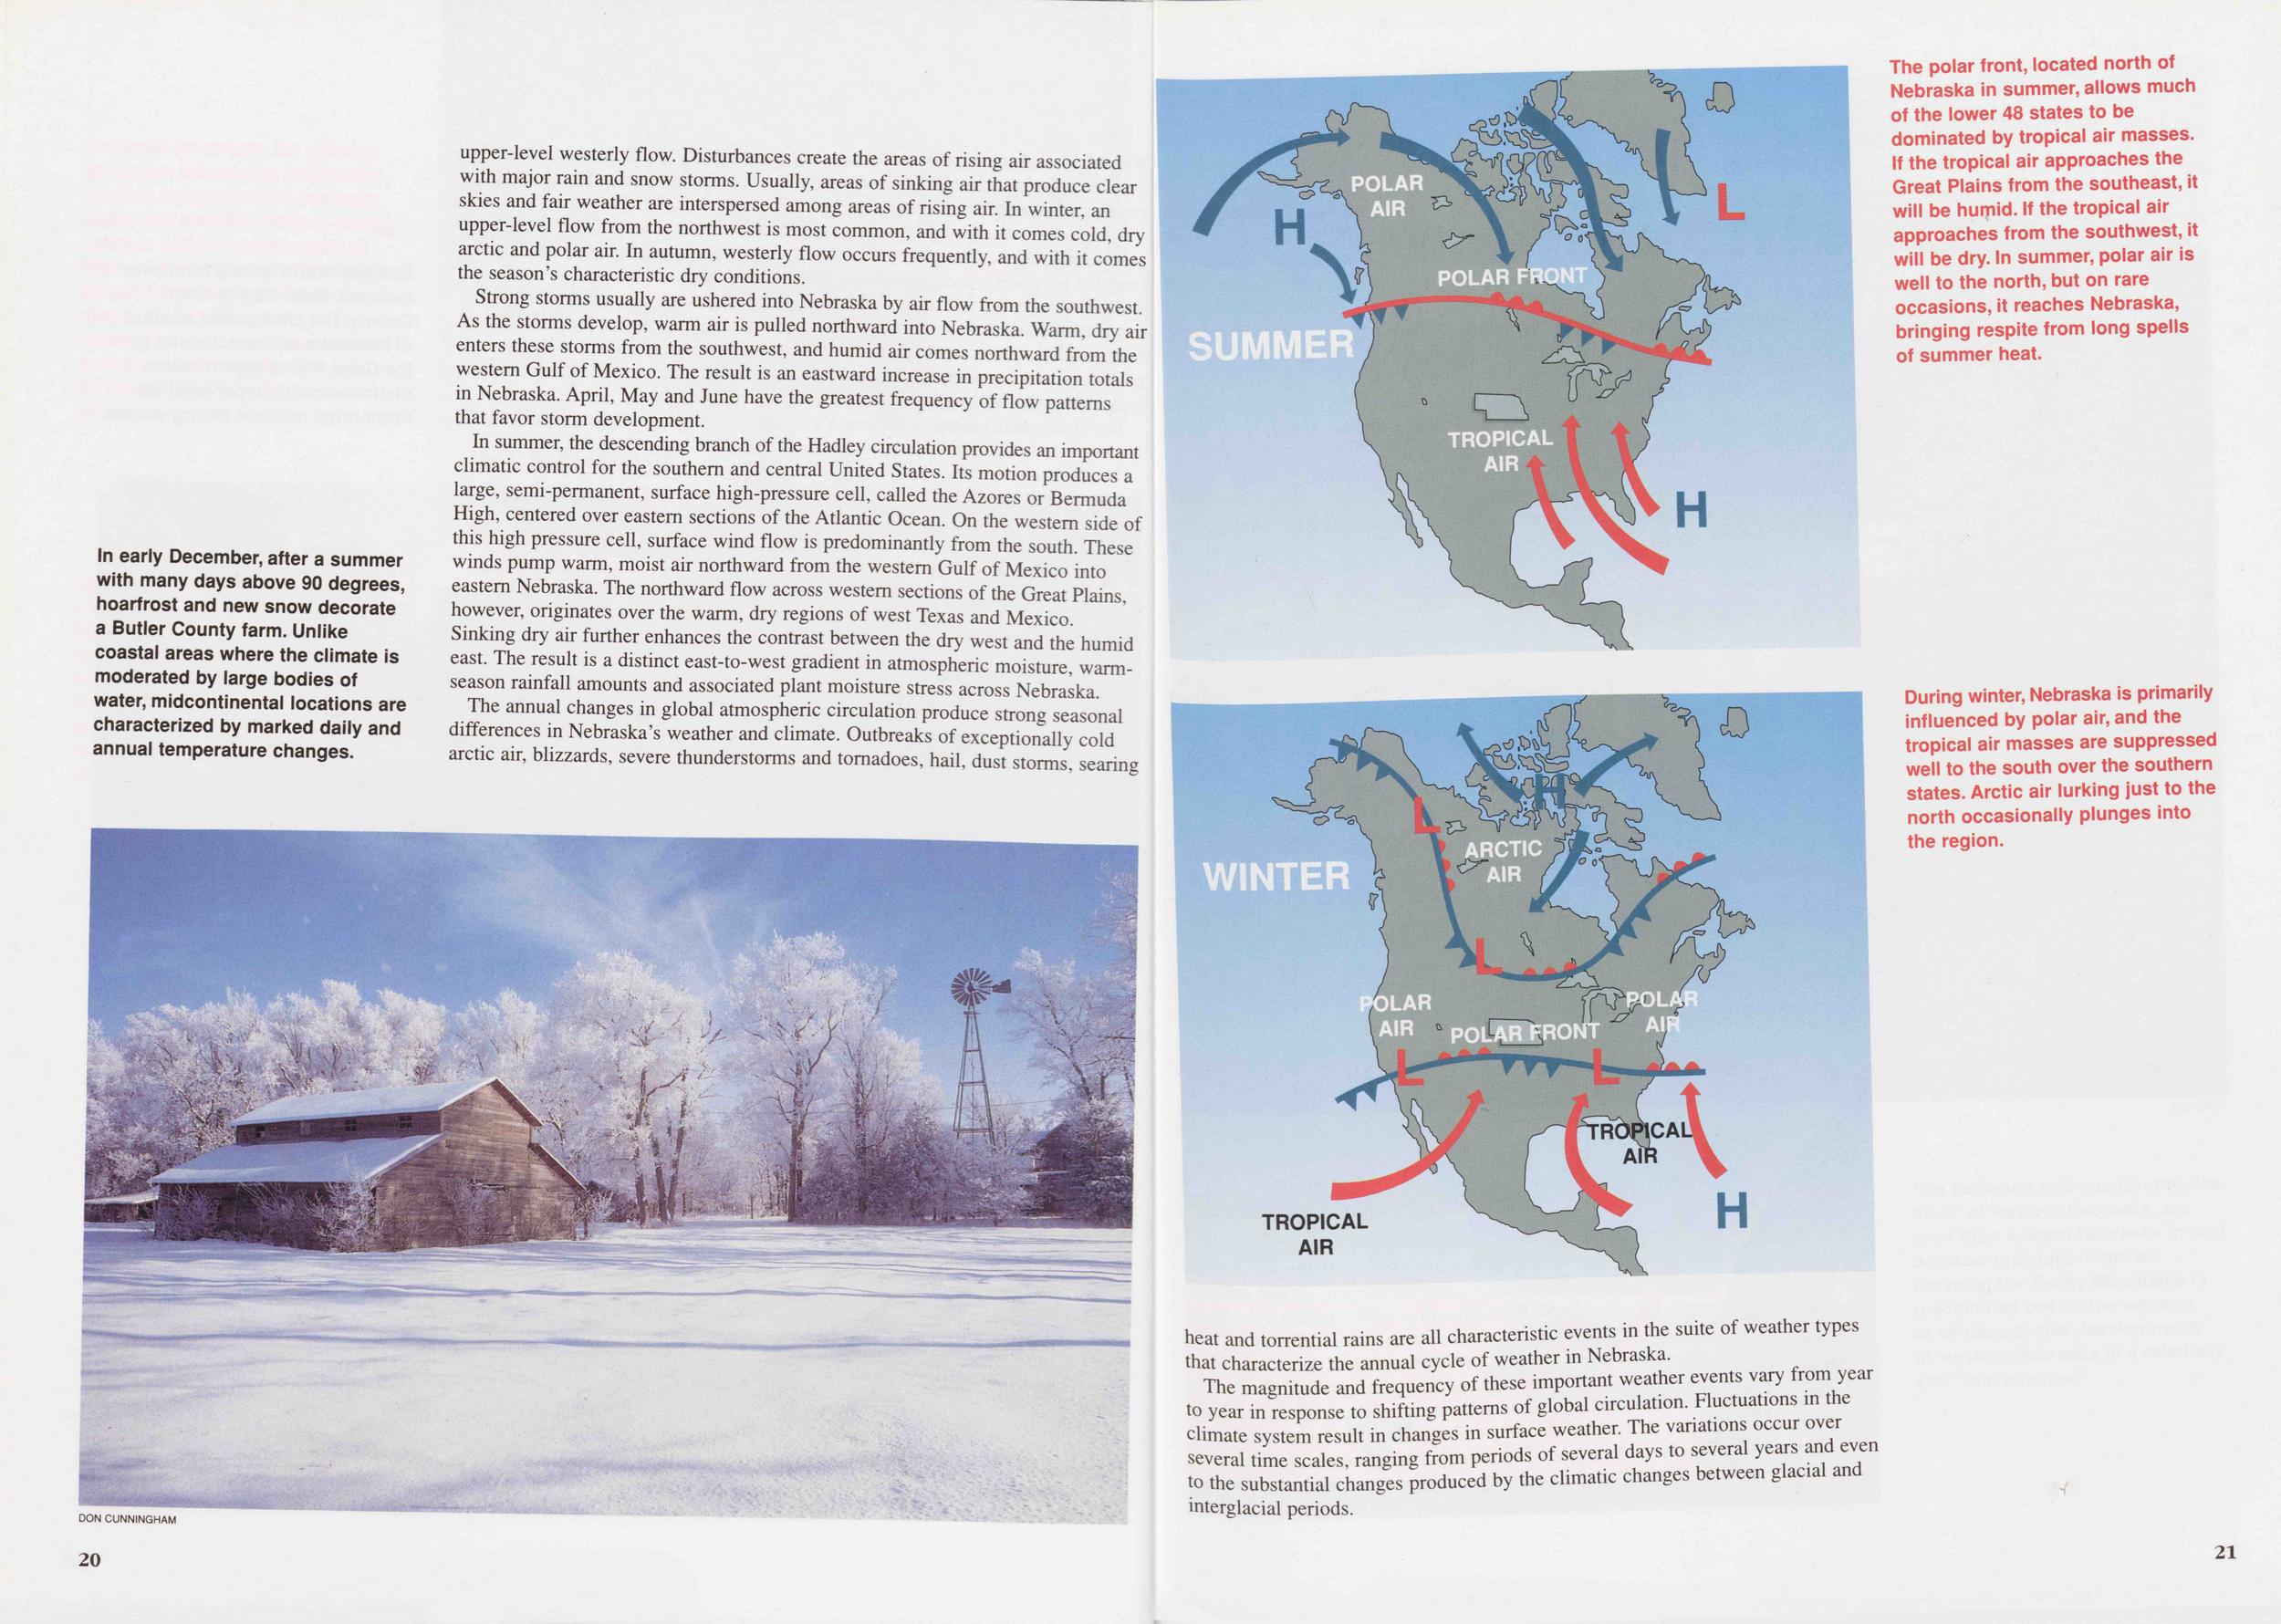
Strong storms usually are ushered into Nebraska by air flow from the southwest. As the storms develop, warm air is pulled northward into Nebraska. Warm, dry air enters these storms from the southwest, and humid air comes northward from the western Gulf of Mexico. The result is an eastward increase in precipitation totals in Nebraska. April, May and June have the greatest frequency of flow patterns that favor storm development.
In summer, the descending branch of the Hadley circulation provides an important climatic control for the southern and central United States. Its motion produces a large, semi-permanent, surface high-pressure cell, called the Azores or Bermuda High, centered over eastern sections of the Atlantic Ocean. On the western side of this high pressure cell, surface wind flow is predominantly from the south. These winds pump warm, moist air northward from the western Gulf of Mexico into eastern Nebraska. The northward flow across western sections of the Great Plains, however, originates over the warm, dry regions of west Texas and Mexico. Sinking dry air further enhances the contrast between the dry west and the humid east. The result is a distinct east-to-west gradient in atmospheric moisture, warm season rainfall amounts and associated plant moisture stress across Nebraska.
The annual changes in global atmospheric circulation produce strong seasonal differences in Nebraska's weather and climate. Outbreaks of exceptionally cold arctic air, blizzards, severe thunderstorms and tornadoes, hail, dust storms, searing
The magnitude and frequency of these important weather events vary from year to year in response to shifting patterns of global circulation. Fluctuations in the climate system result in changes in surface weather. The variations occur over several time scales, ranging from periods of several days to several years and even to the substantial changes produced by the climatic changes between glacial and interglacial periods.
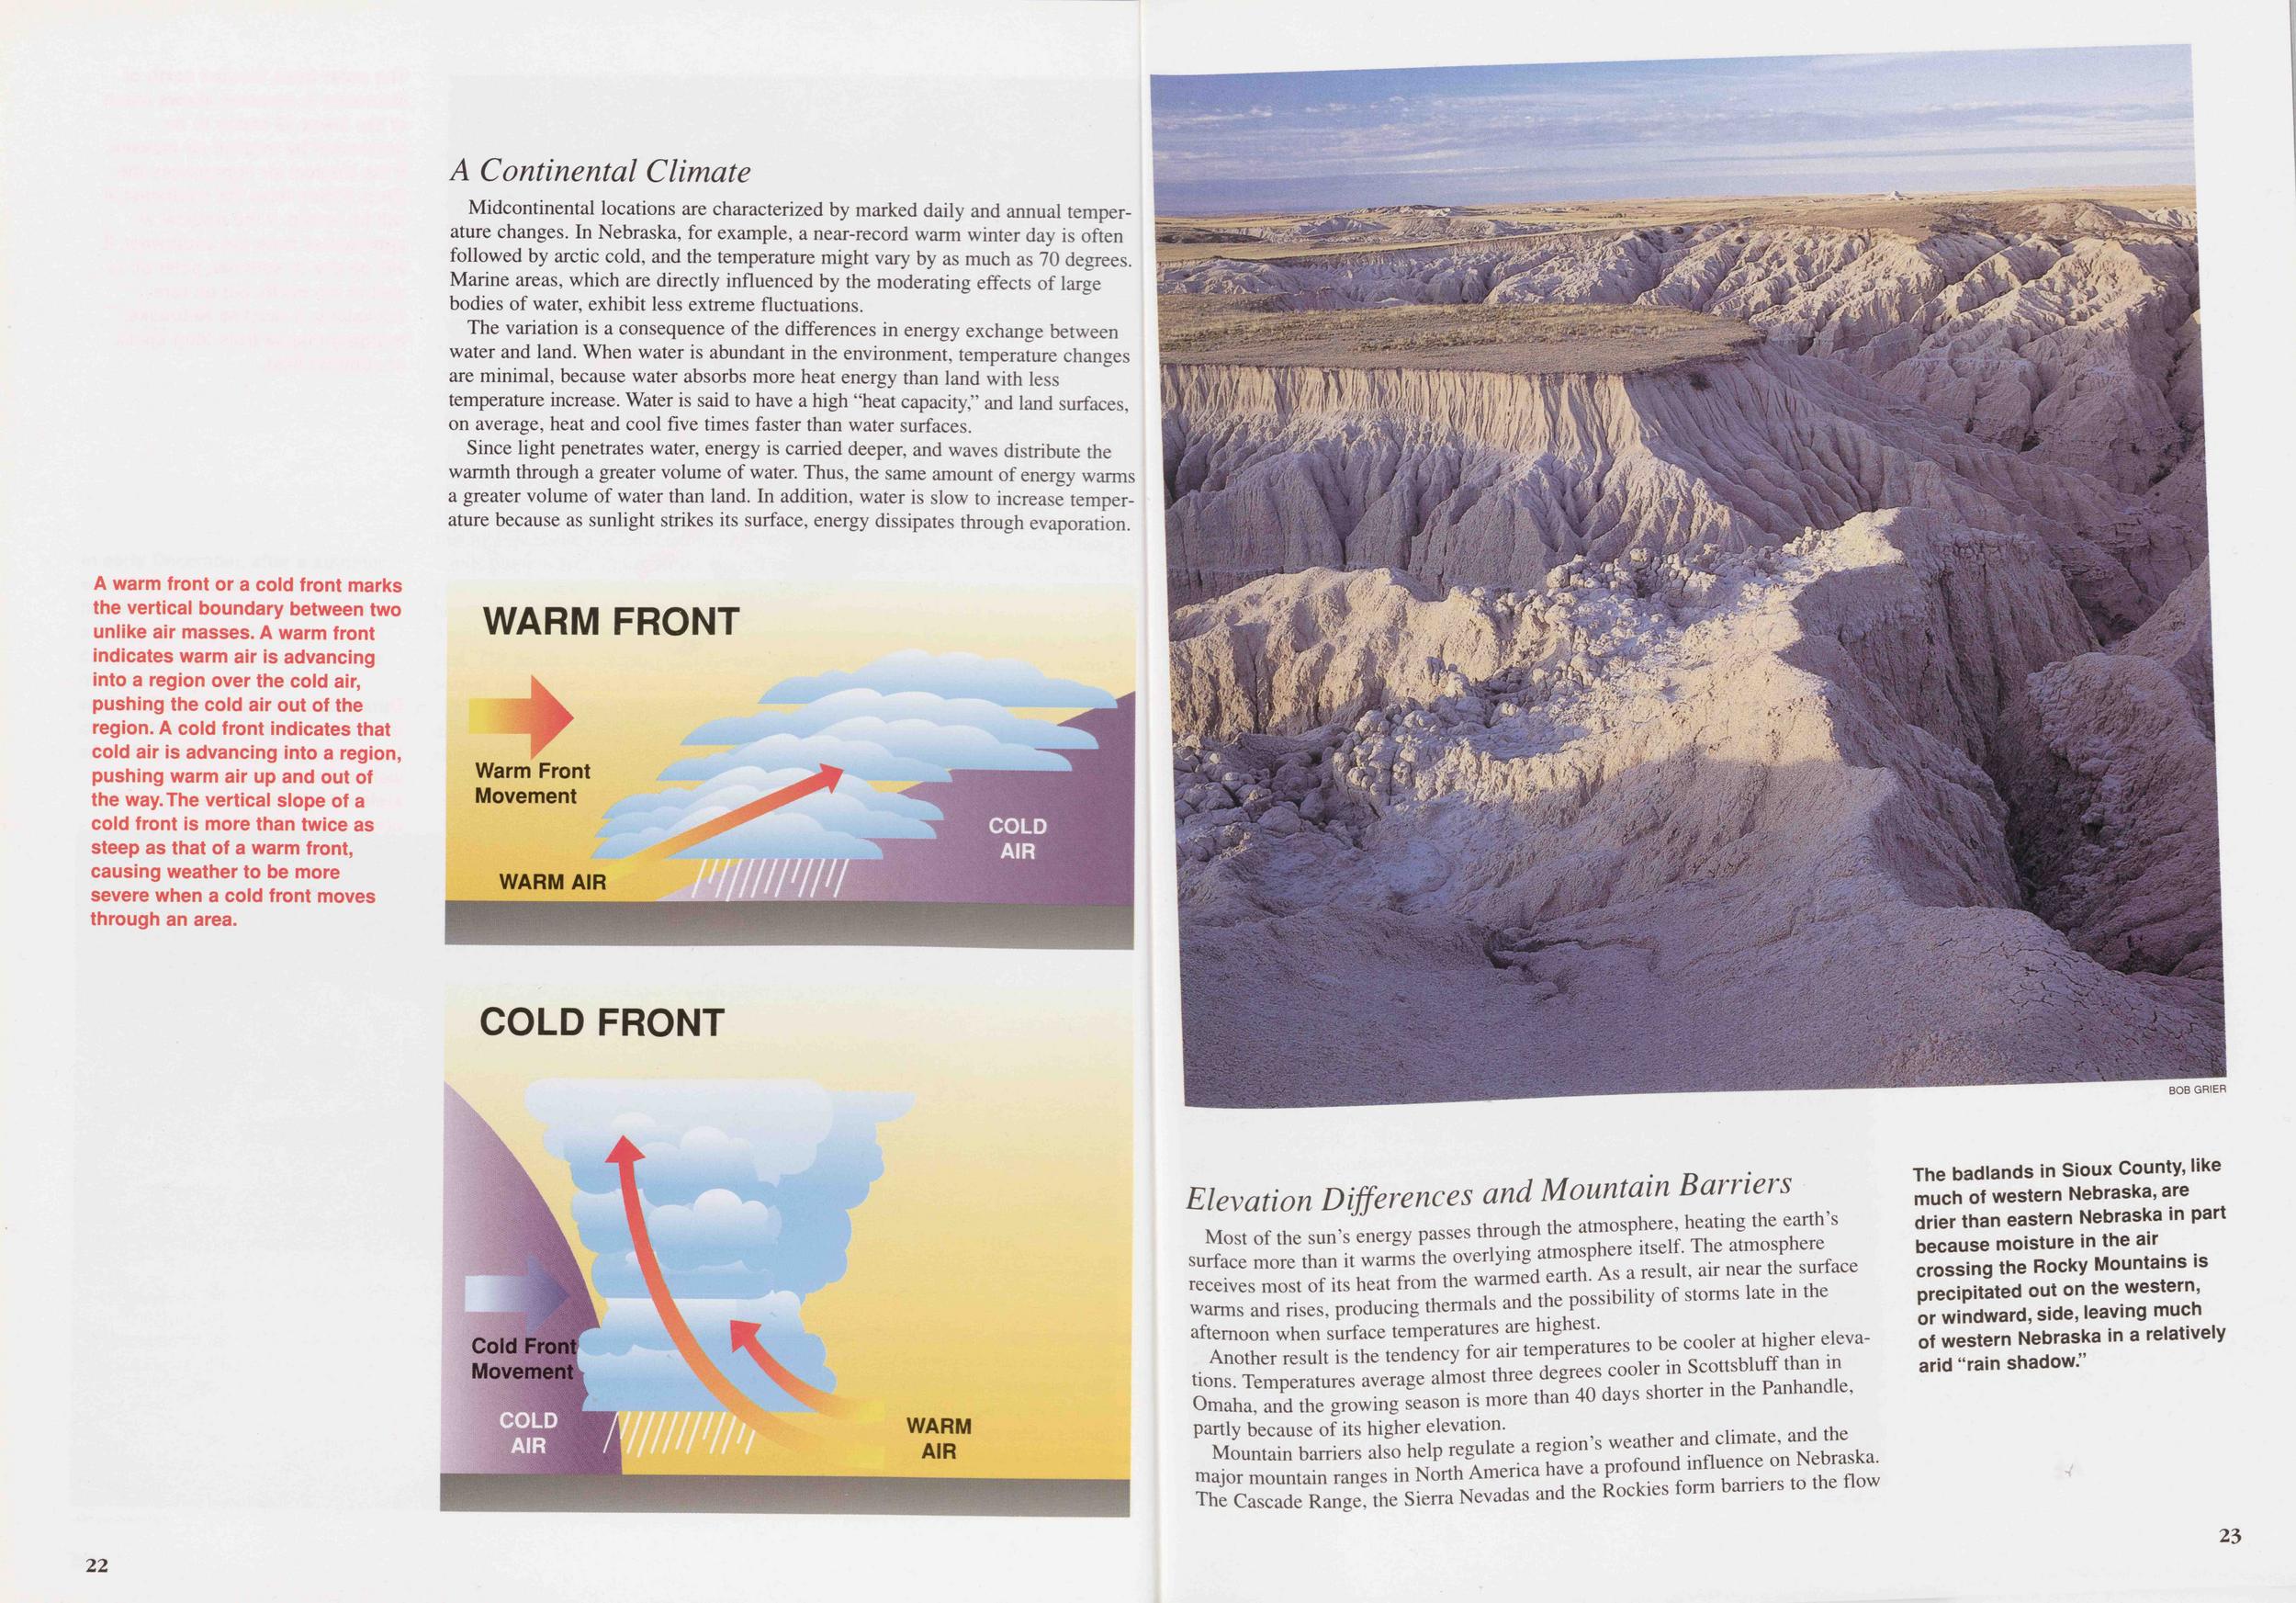
Midcontinental locations are characterized by marked daily and annual temperature changes. In Nebraska, for example, a near-record warm winter day is often followed by arctic cold, and the temperature might vary by as much as 70 degrees. Marine areas, which are directly influenced by the moderating effects of large bodies of water, exhibit less extreme fluctuations.
The variation is a consequence of the differences in energy exchange between water and land. When water is abundant in the environment, temperature changes are minimal, because water absorbs more heat energy than land with less temperature increase. Water is said to have a high "heat capacity," and land surfaces, on average, heat and cool five times faster than water surfaces.
Since light penetrates water, energy is carried deeper, and waves distribute the warmth through a greater volume of water. Thus, the same amount of energy warms a greater volume of water than land. In addition, water is slow to increase temperature because as sunlight strikes its surface, energy dissipates through evaporation.
22 Elevation Differences and Mountain BarriersMost of the sun's energy passes through the atmosphere surface more than it warms the overlying atmosphere itself. The "reserves most of its heat from the warms and rises, producing thermals and the afternoon when surface temperatures are highest.
Another result is the tendency Temperatures average almost three degrees Panhandle,Omaha, and the growing season is more than 40 days sooner partly because of its higher elevation.
Mountain barriers also help regulate a region's major mountain ranges in North America The Cascade Range, the Sierra Nevadas and the Rockies
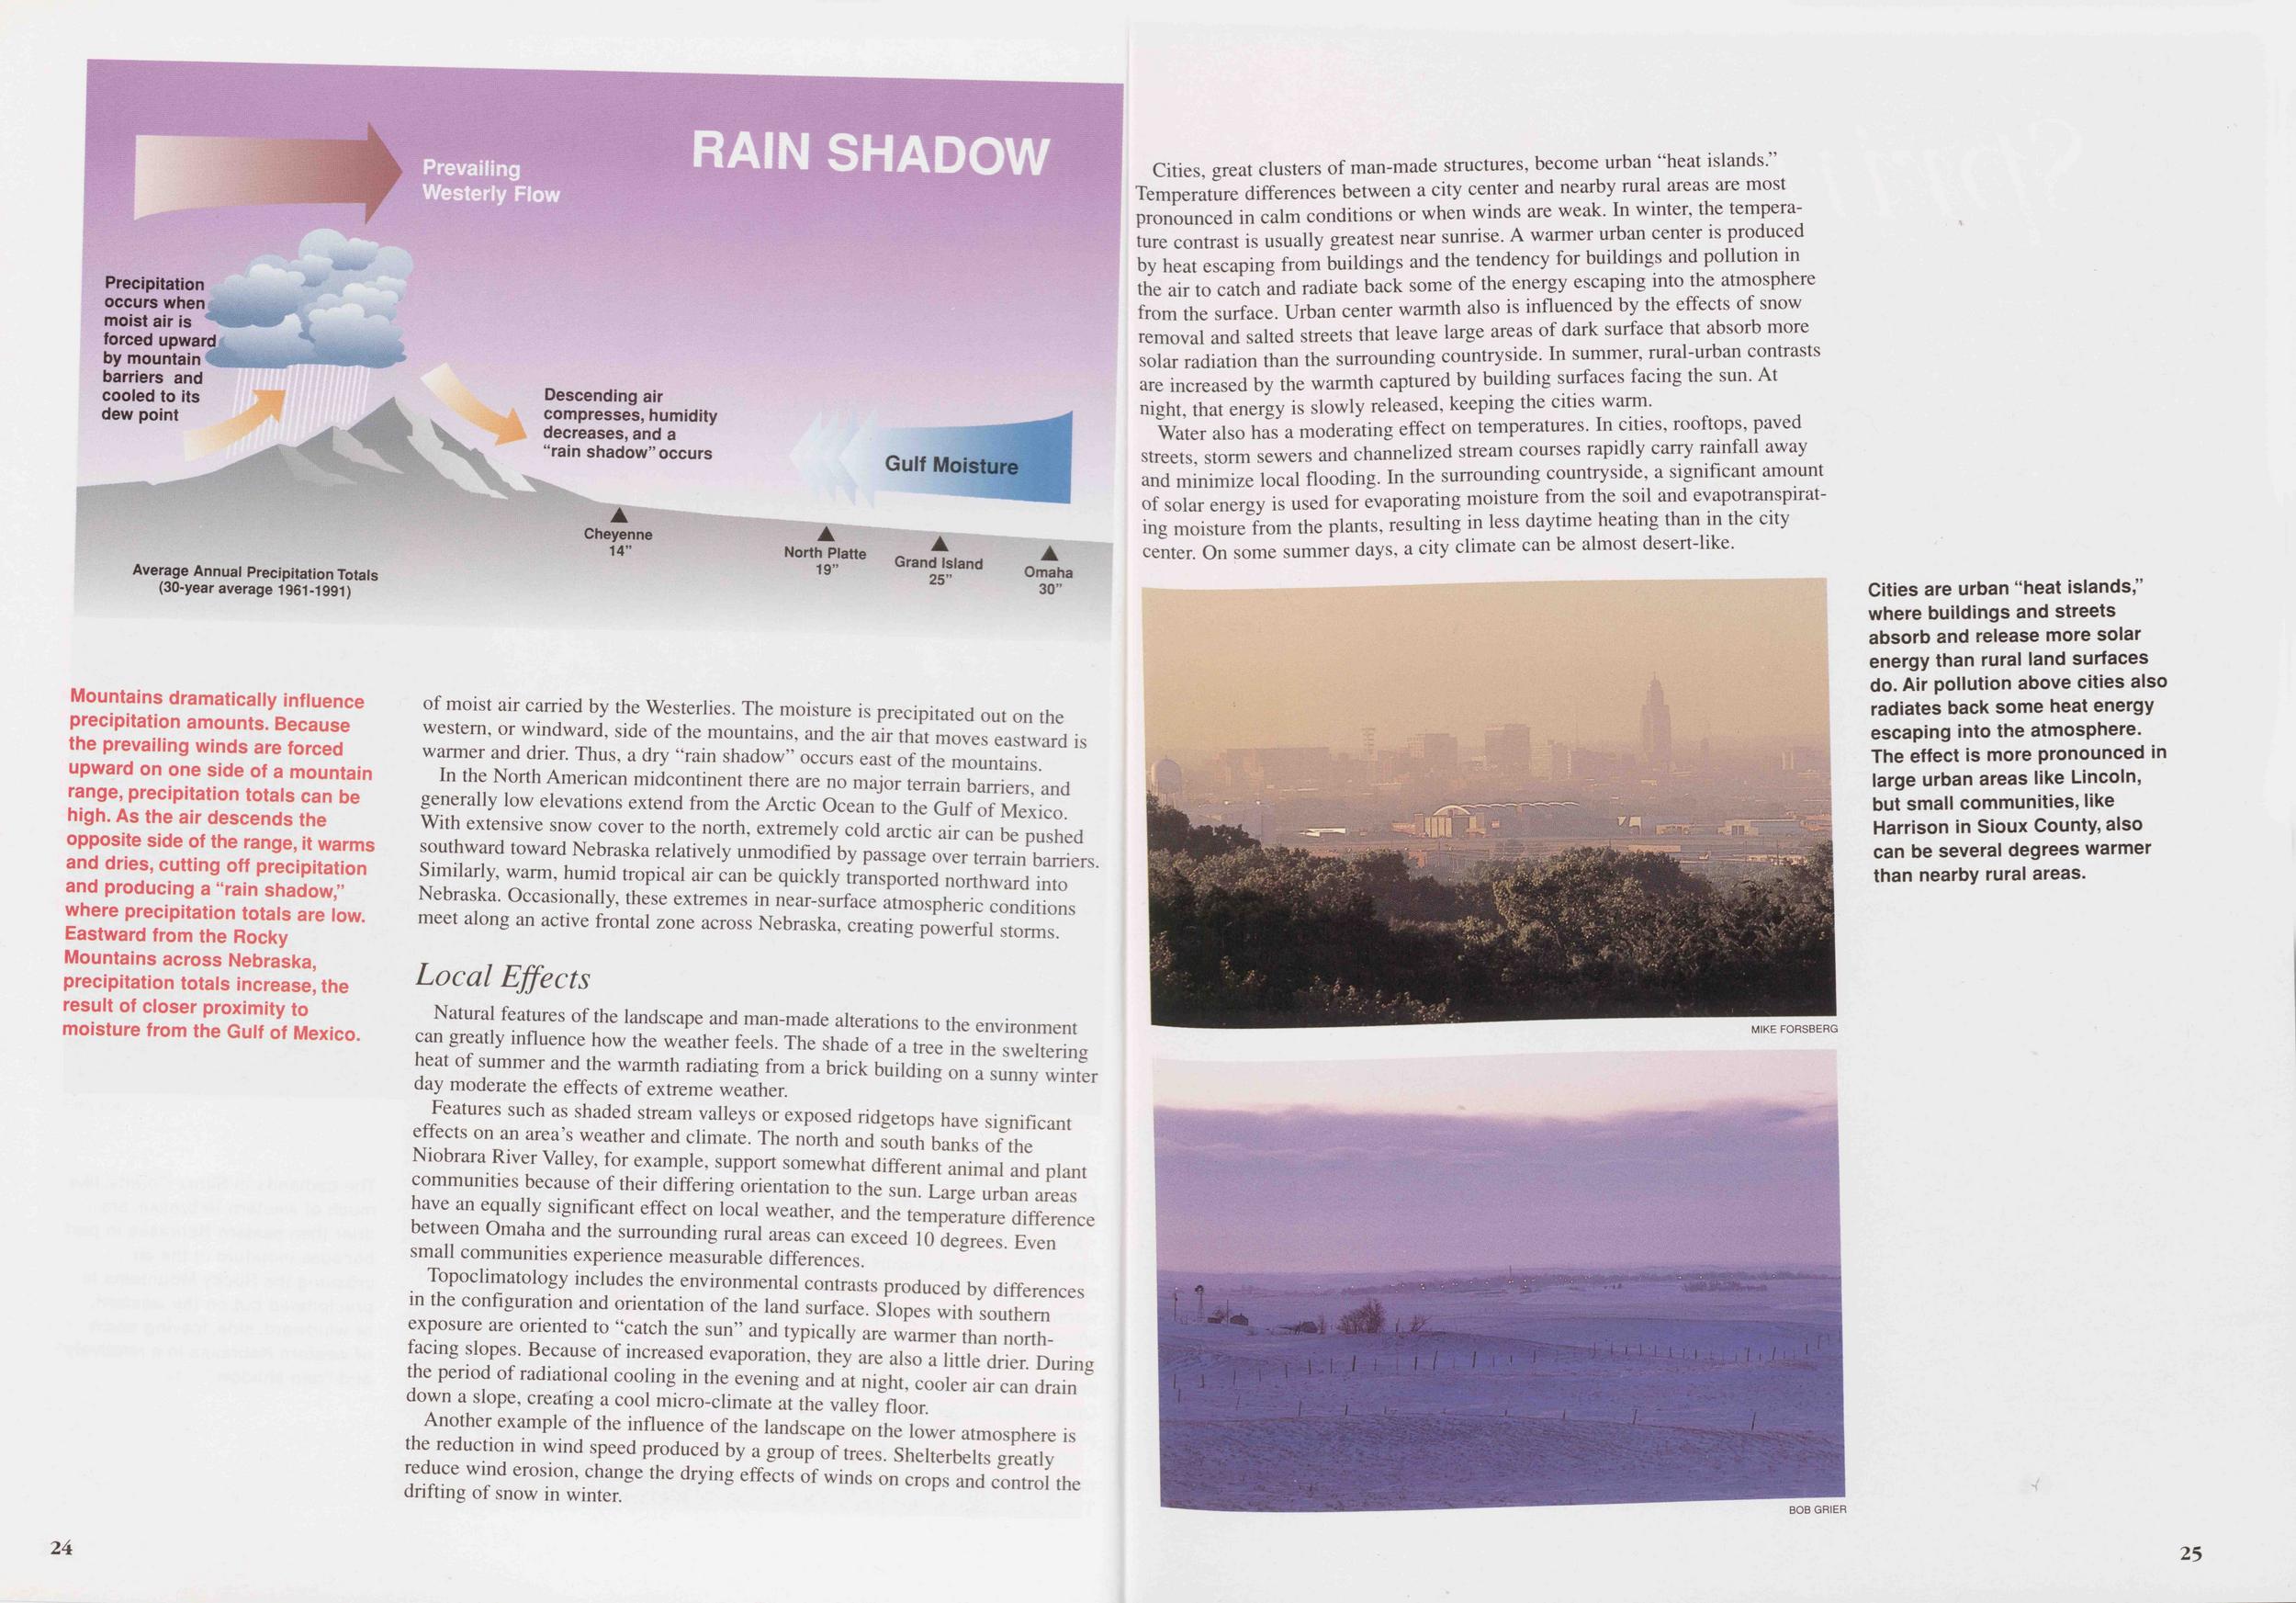
In the North American midcontinent there are no major terrain barriers, and generally low elevations extend from the Arctic Ocean to the Gulf of Mexico. With extensive snow cover to the north, extremely cold arctic air can be pushed southward toward Nebraska relatively unmodified by passage over terrain barriers. Similarly, warm, humid tropical air can be quickly transported northward into Nebraska. Occasionally, these extremes in near-surface atmospheric conditions meet along an active frontal zone across Nebraska, creating powerful storms.
Local EffectsNatural features of the landscape and man-made alterations to the environment can greatly influence how the weather feels. The shade of a tree in the sweltering heat of summer and the warmth radiating from a brick building on a sunny winter day moderate the effects of extreme weather.
Features such as shaded stream valleys or exposed ridge tops have significant effects on an area's weather and climate. The north and south banks of the Niobrara River Valley, for example, support somewhat different animal and plant communities because of their differing orientation to the sun. Large urban areas have an equally significant effect on local weather, and the temperature difference between Omaha and the surrounding rural areas can exceed 10 degrees. Even small communities experience measurable differences.
Top climatology includes the environmental contrasts produced by differences in the configuration and orientation of the land surface. Slopes with southern exposure are oriented to "catch the sun" and typically are warmer than north facing slopes. Because of increased evaporation, they are also a little drier. During the period of radiational cooling in the evening and at night, cooler air can drain down a slope, creating a cool micro-climate at the valley floor.
Another example of the influence of the landscape on the lower atmosphere is the reduction in wind speed produced by a group of trees. Shelter belts greatly reduce wind erosion, change the drying effects of winds on crops and control the drifting of snow in winter.
24Cities great clusters of man-made structures, become urban "heat islands." Temperature differences between a city center and nearby rural areas are most pronounced in calm conditions or when winds are weak. In winter, the temperature contrast is usually greatest near sunrise. A warmer urban center is produced by heat escaping from buildings and the tendency for buildings and pollution in the air to catch and radiate back some of the energy escaping into the atmosphere from the surface. Urban center warmth also is influenced by the effects of snow removal and salted streets that leave large areas of dark surface that absorb more solar radiation than the surrounding countryside. In summer, rural-urban contrasts are increased by the warmth captured by building surfaces facing the sun. At night that energy is slowly released, keeping the cities warm.
Water also has a moderating effect on temperatures. In cities, rooftops, paved streets storm sewers and channelized stream courses rapidly carry rainfall away and minimize local flooding. In the surrounding countryside, a significant amount of solar energy is used for evaporating moisture from the soil and evapotranspirating moisture from the plants, resulting in less daytime heating than in the city center. On some summer days, a city climate can be almost desert-like.
Spring
The Turbulent Season
By Natalie Williams and Wai-Lok Siu Department of Geography, University of Nebraska-LincolnIN ANCIENT TIMES, spring was heralded by the first rumble of thunder. In modern times, spring officially arrives on the vernal equinox, about March 21. In the first few weeks of spring, the clouds and the landscape begin to change dramatically. The sky is dotted with cumulus clouds, the gray overcast of winter is gone, and the ground begins to thaw. Throughout Nebraska, drab winter colors are replaced by the fresh, vivid colors of spring. Trees bud, and bright green leaves appear.
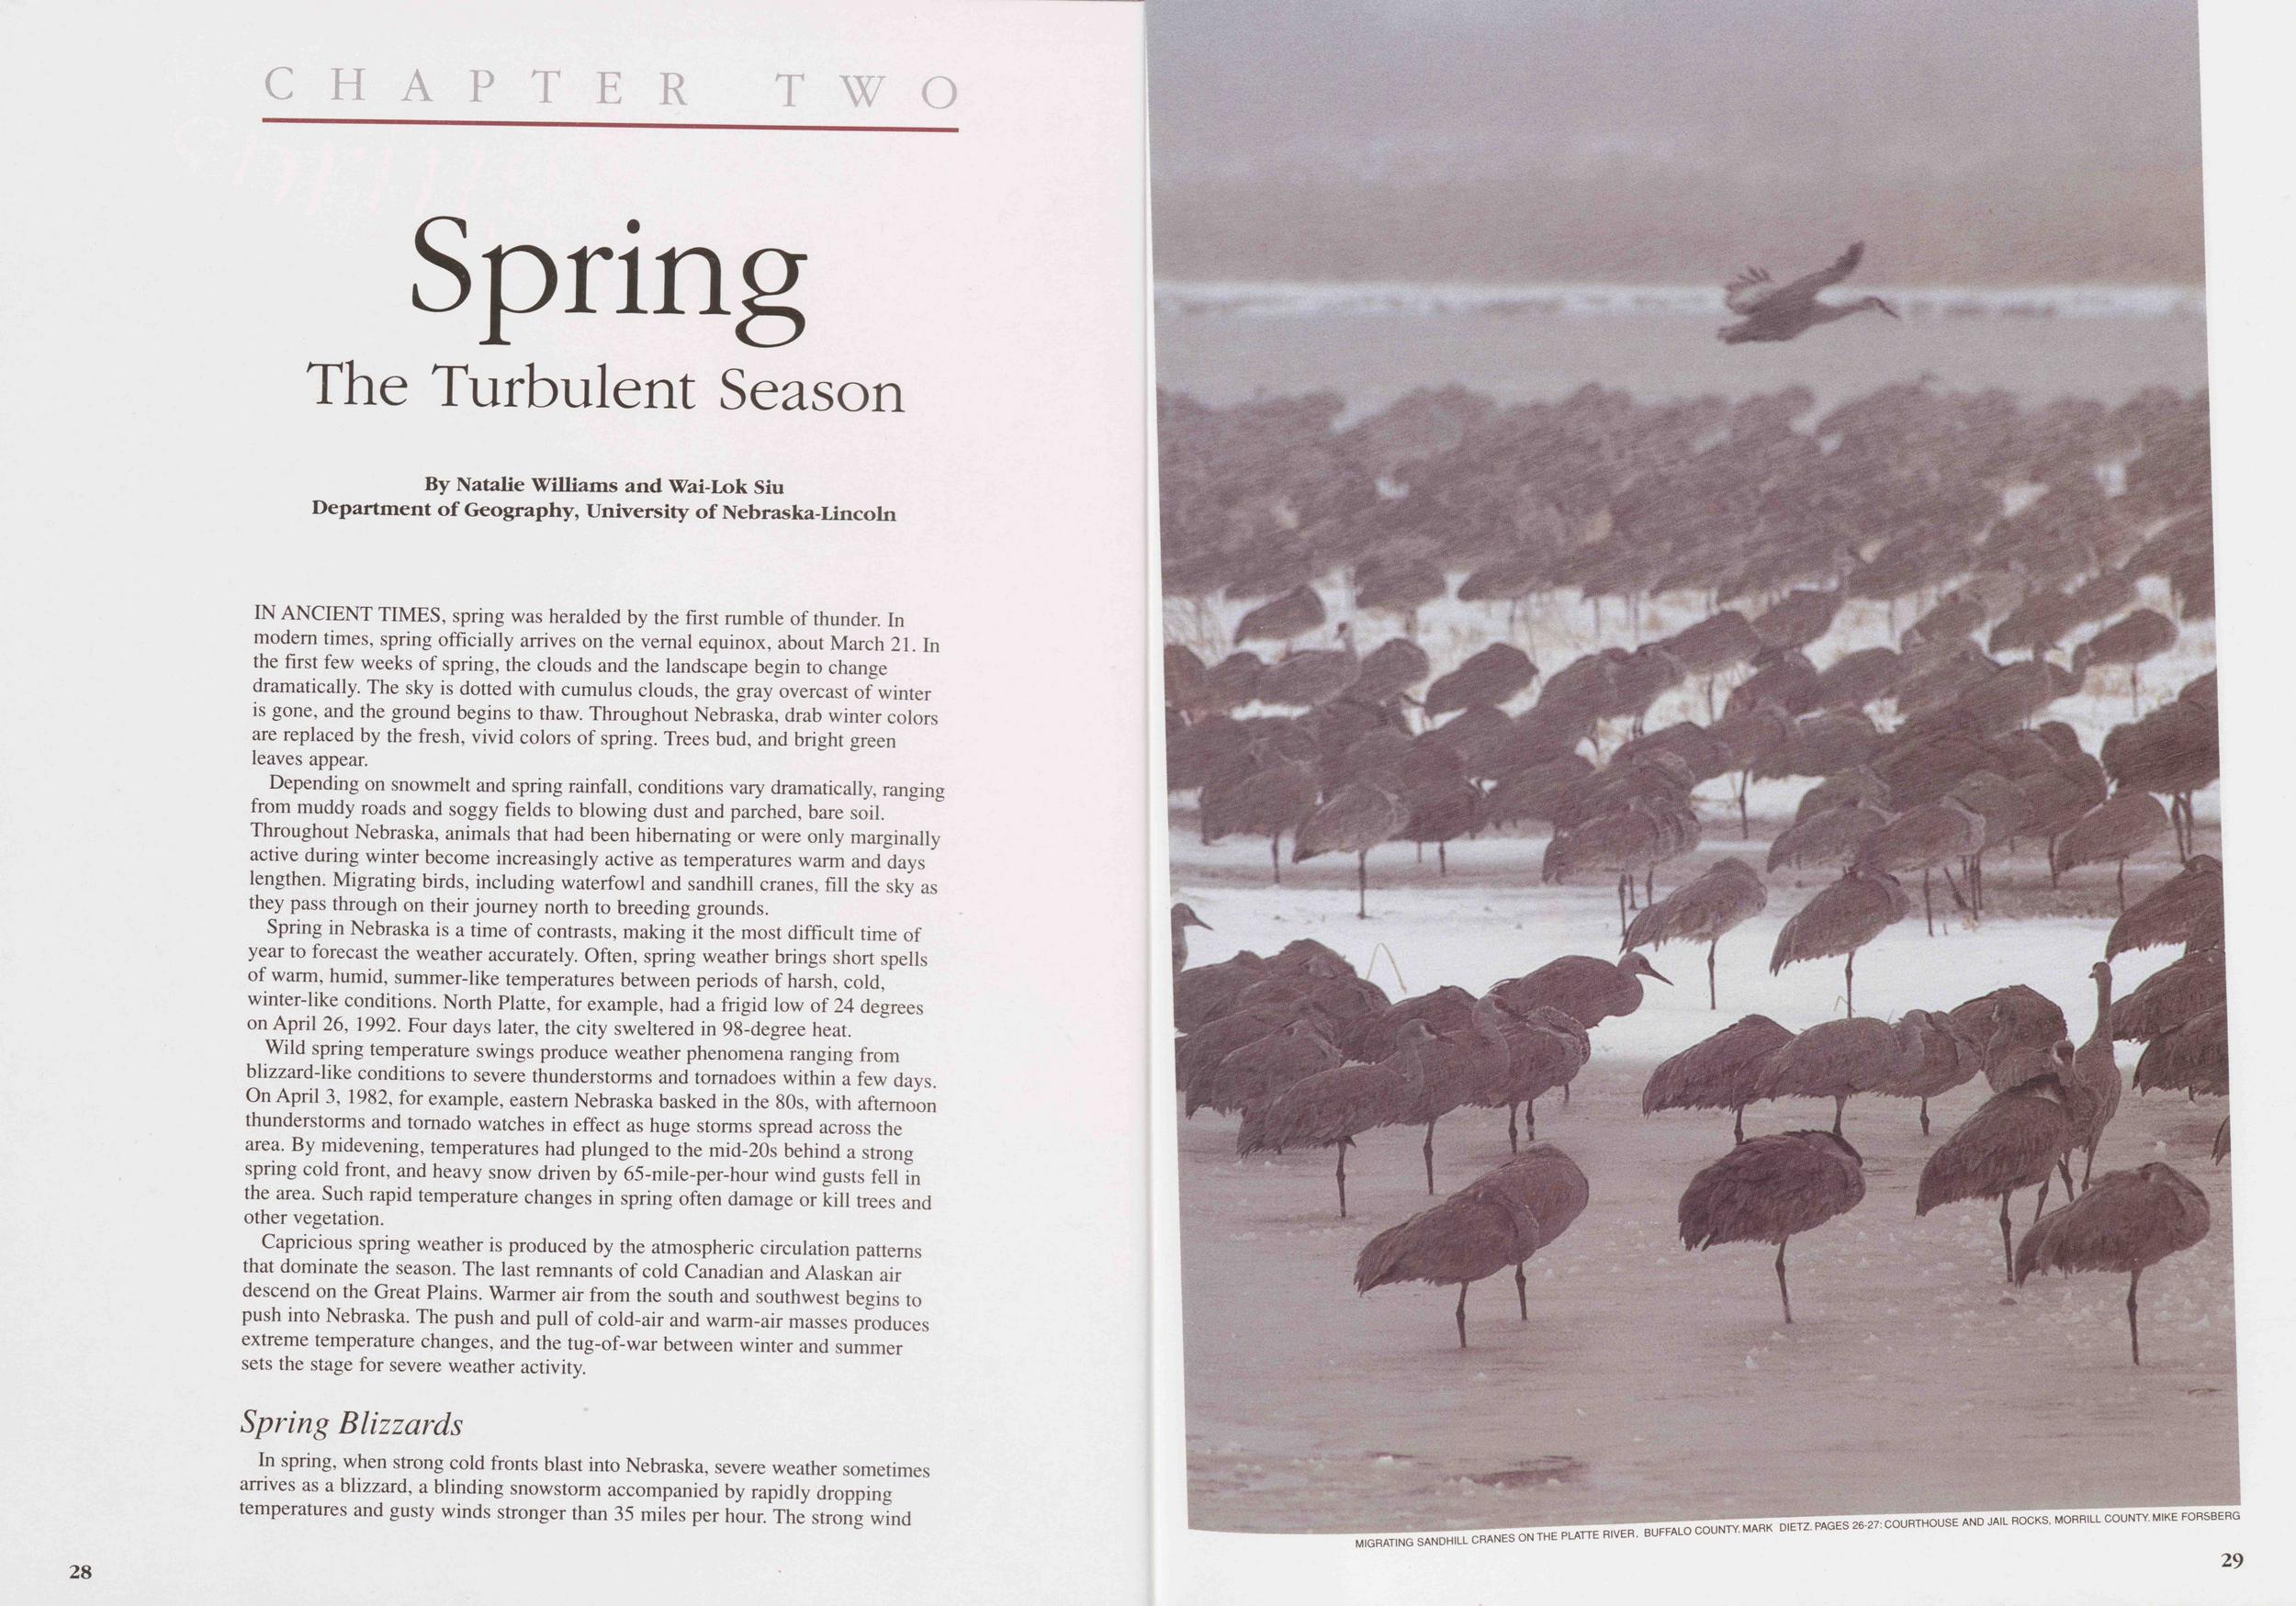
Depending on snowmelt and spring rainfall, conditions vary dramatically, ranging from muddy roads and soggy fields to blowing dust and parched, bare soil. Throughout Nebraska, animals that had been hibernating or were only marginally active during winter become increasingly active as temperatures warm and days lengthen. Migrating birds, including waterfowl and sandhill cranes, fill the sky as they pass through on their journey north to breeding grounds.
Spring in Nebraska is a time of contrasts, making it the most difficult time of year to forecast the weather accurately. Often, spring weather brings short spells of warm, humid, summer-like temperatures between periods of harsh, cold, winter-like conditions. North Platte, for example, had a frigid low of 24 degrees on April 26, 1992. Four days later, the city sweltered in 98-degree heat.
Wild spring temperature swings produce weather phenomena ranging from blizzard-like conditions to severe thunderstorms and tornadoes within a few days. On April 3, 1982, for example, eastern Nebraska basked in the 80s, with afternoon thunderstorms and tornado watches in effect as huge storms spread across the area. By midevening, temperatures had plunged to the mid-20s behind a strong spring cold front, and heavy snow driven by 65-mile-per-hour wind gusts fell in the area. Such rapid temperature changes in spring often damage or kill trees and other vegetation.
Capricious spring weather is produced by the atmospheric circulation patterns that dominate the season. The last remnants of cold Canadian and Alaskan air descend on the Great Plains. Warmer air from the south and southwest begins to push into Nebraska. The push and pull of cold-air and warm-air masses produces extreme temperature changes, and the tug-of-war between winter and summer sets the stage for severe weather activity.
Spring BlizzardsIn spring, when strong cold fronts blast into Nebraska, severe weather sometimes arrives as a blizzard, a blinding snowstorm accompanied by rapidly dropping temperatures and gusty winds stronger than 35 miles per hour. The strong wind 28
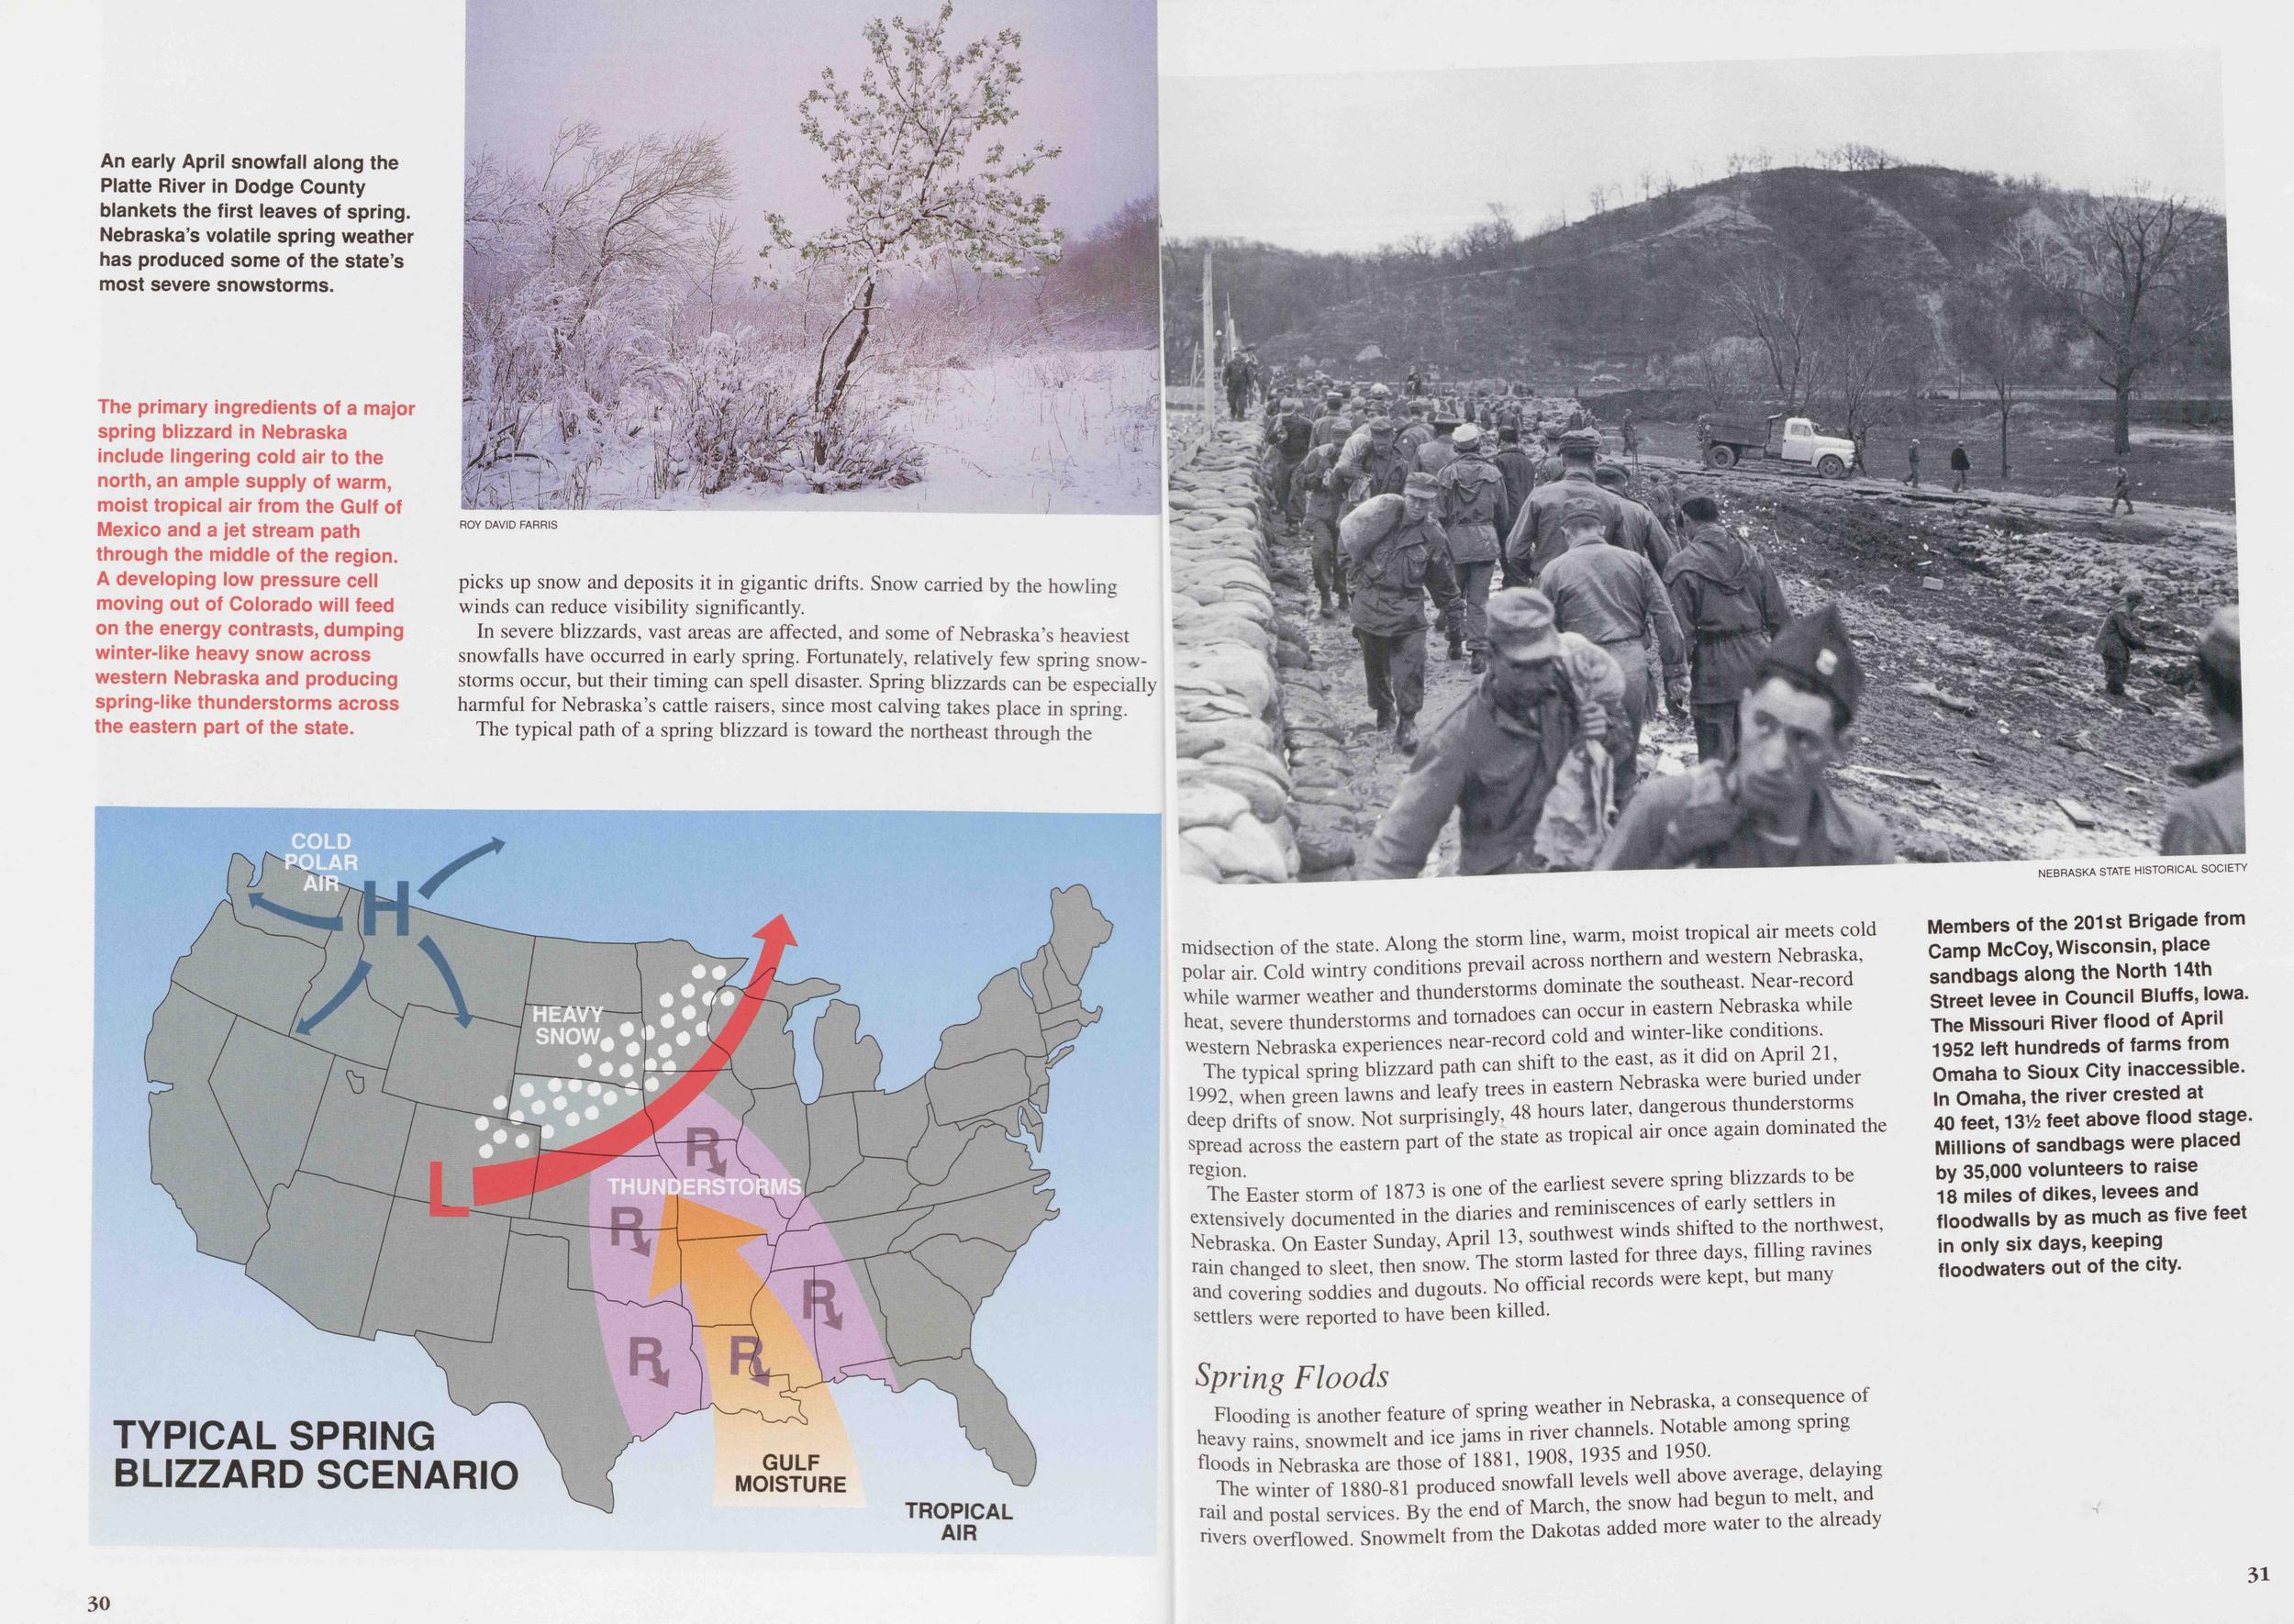
In severe blizzards, vast areas are affected, and some of Nebraska's heaviest snowfalls have occurred in early spring. Fortunately, relatively few spring snowstorms occur, but their timing can spell disaster. Spring blizzards can be especially harmful for Nebraska's cattle raisers, since most calving takes place in spring.
The typical path of a spring blizzard is toward the northeast through the 30
The typical spring blizzard path can shift to the east, as it did on April 21, trees in eastern Nebraska were buried under 1992, when green lawns and leafy trees.in thunderstorms deep drifts of snow. Not air once again dominated the spread across the eastern part of the state as tropicai a
"Easter storm of 1873 is one of the exrenswel, documented , Nebraska. On Easter Sunday, days, filling ravines rain changed to sleet, then snow. They were k/1, but many and covering soddies and dugouts. No official records were settlers were reported to have been killed.
Spring FloodsFlooding is another feature of spring weather in heavy rains, snowmelt and ice jams in river floods in Nebraska are those of 1881, 1908 935 and 1950.
The winter of 1880-81 produced snowfall levels well above rail and postal services. By the end of March, the snow had to meet rivers overflowed. Snowmelt from the Dakotas added more water to the already 31 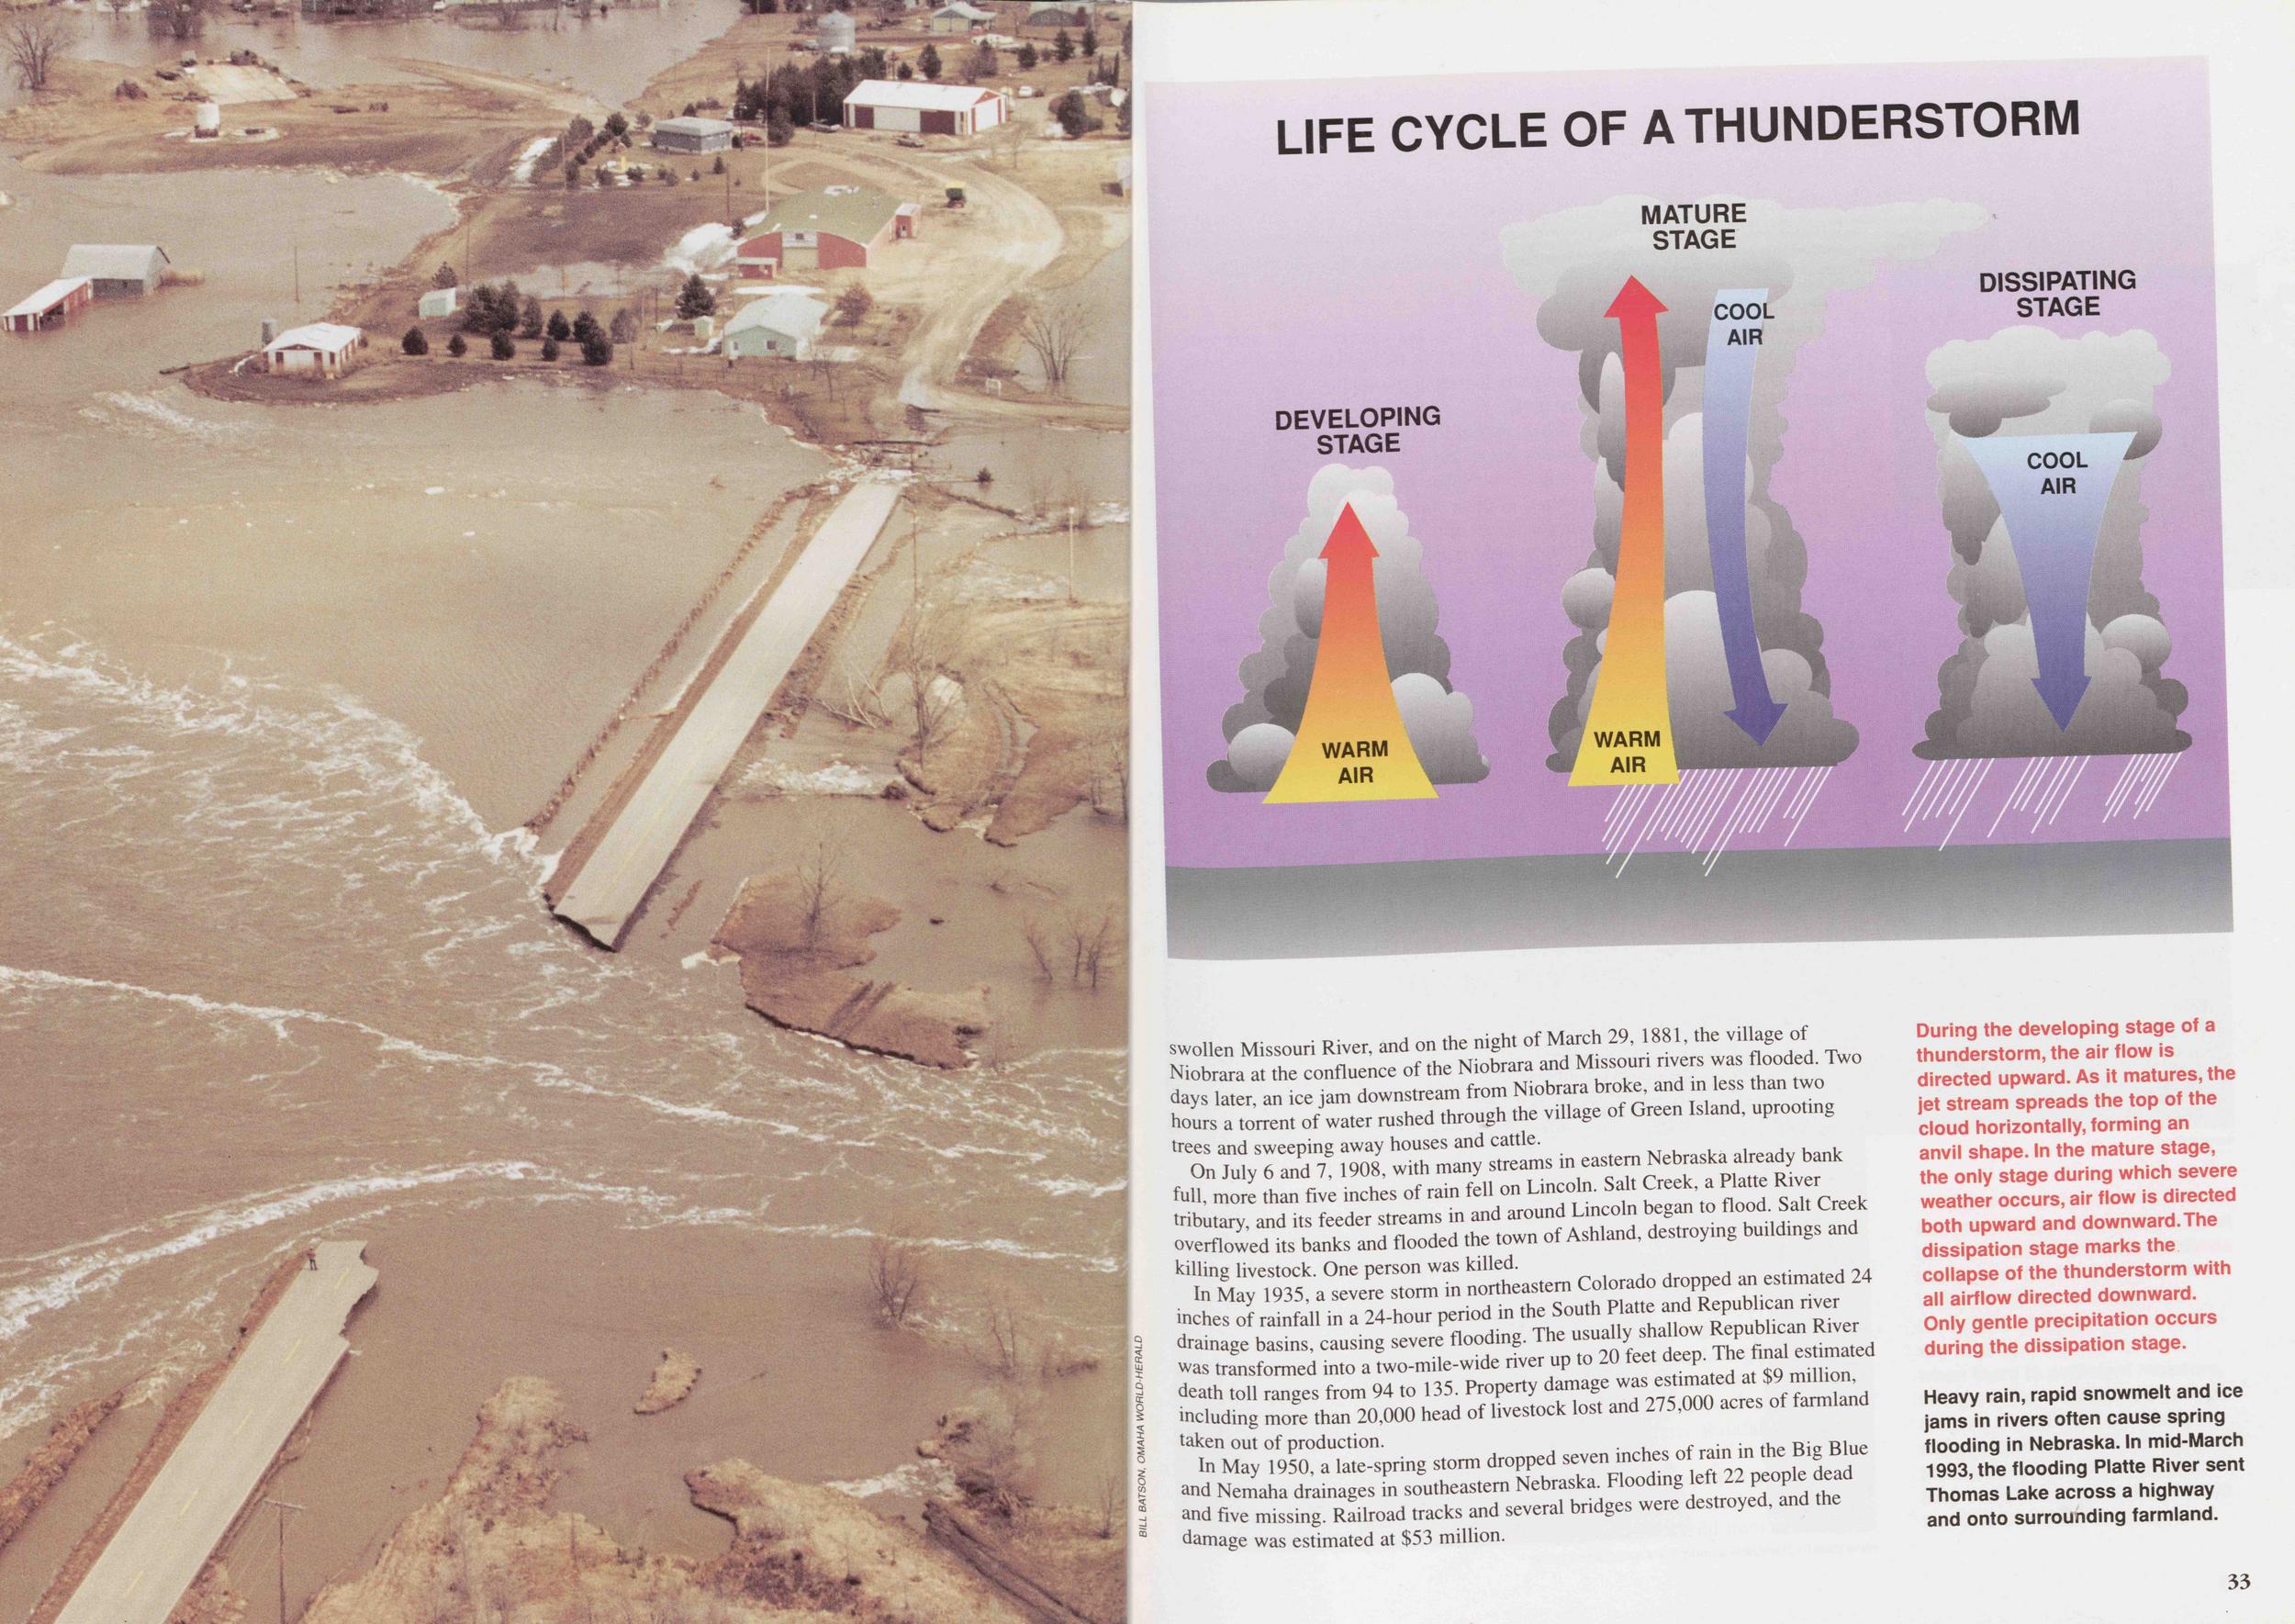
its banks and flooded the town of Ashland, destroying
northeastern Colorado dropped an estimated 24 Property damage was estimated at million, and 275.00 aces of
forest dropped seven inches and Nemaha drainages in southeastern Nebraska and five missing Railroad .racks and several bridges were destroyed, and the damage was estimated at $53 million.
Although thunderstorms occur in all months of the year, it usually is not until late March that they become common in Nebraska. Spring thunderstorms bring lightning, gusty winds, heavy rain, hail and tornadoes. Although spring and summer thunderstorms are about equal in number, spring storms bring fiercer winds and stronger tornadoes.
Most areas in Nebraska average about 50 days per year with thunderstorms and about 70 thunderstorms per year. The frequency of thunderstorm days and the total number of thunderstorms is slightly higher in the southeastern corner of the state than it is in the drier western part.
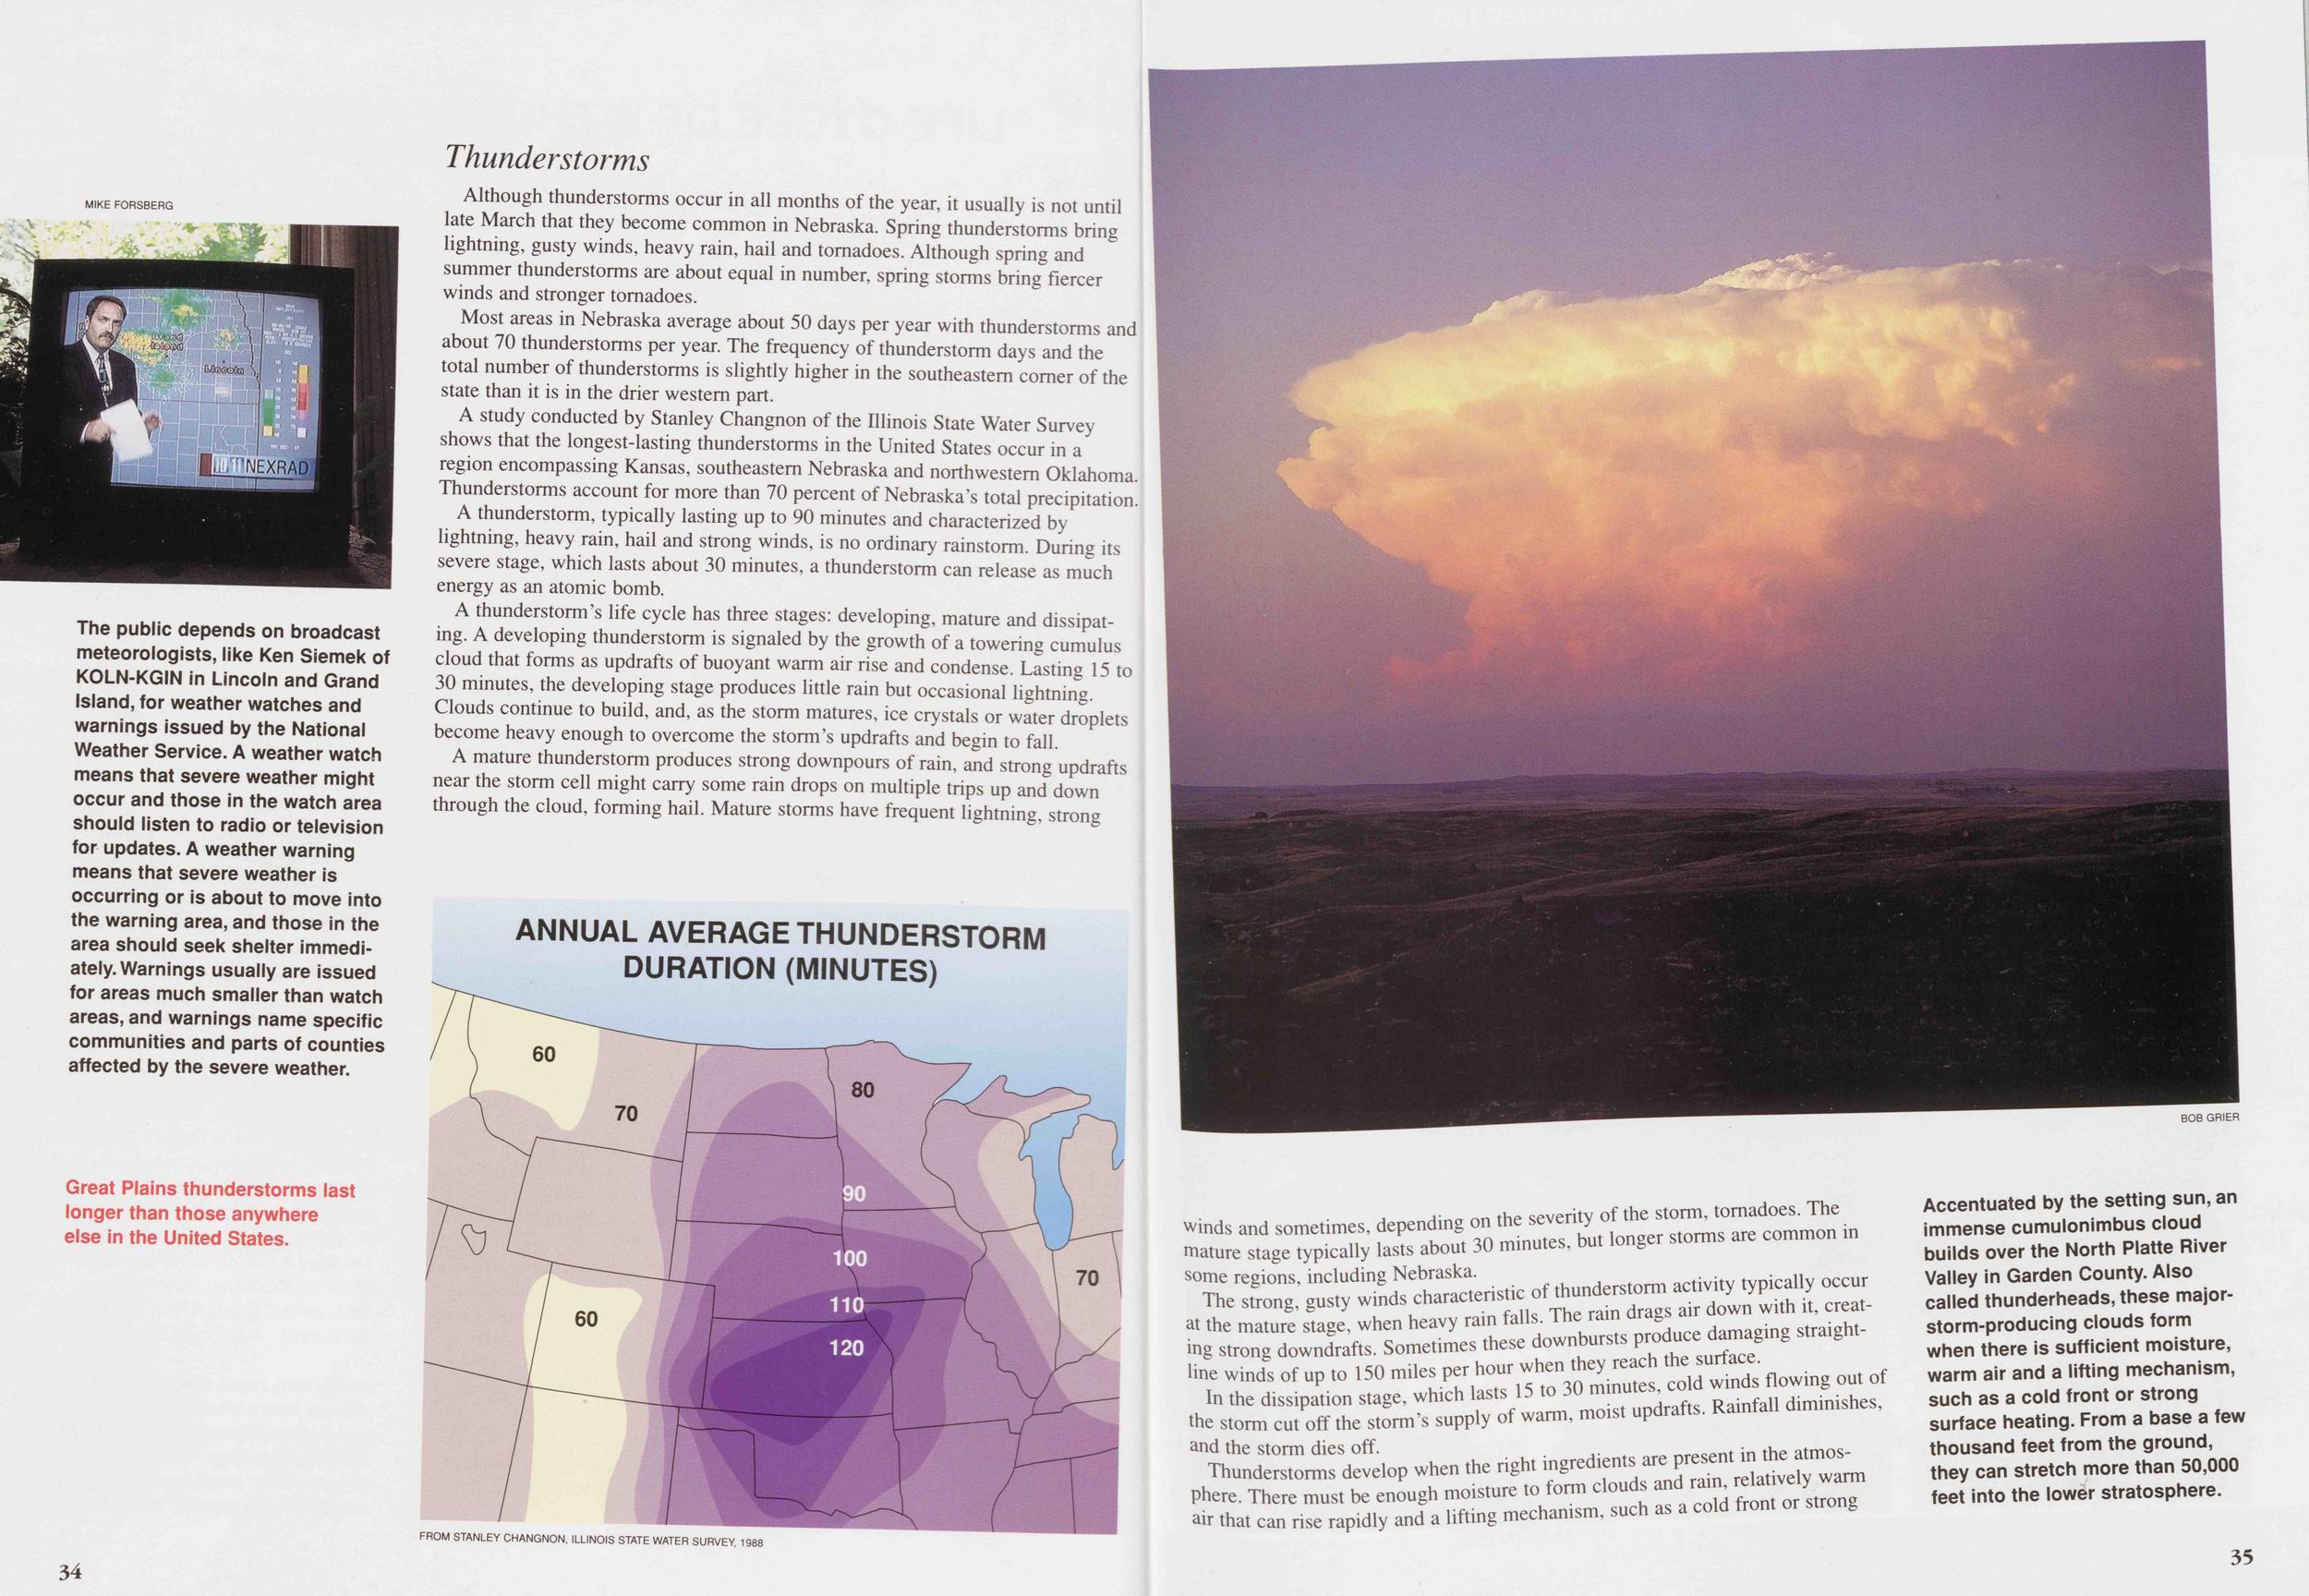
A study conducted by Stanley Changnon of the Illinois State Water Survey shows that the longest-lasting thunderstorms in the United States occur in a region encompassing Kansas, southeastern Nebraska and northwestern Oklahoma. Thunderstorms account for more than 70 percent of Nebraska's total precipitation.
A thunderstorm, typically lasting up to 90 minutes and characterized by lightning, heavy rain, hail and strong winds, is no ordinary rainstorm. During its severe stage, which lasts about 30 minutes, a thunderstorm can release as much energy as an atomic bomb.
A thunderstorm's life cycle has three stages: developing, mature and dissipating. A developing thunderstorm is signaled by the growth of a towering cumulus cloud that forms as updrafts of buoyant warm air rise and condense. Lasting 15 to 30 minutes, the developing stage produces little rain but occasional lightning. Clouds continue to build, and, as the storm matures, ice crystals or water droplets become heavy enough to overcome the storm's updrafts and begin to fall.
A mature thunderstorm produces strong downpours of rain, and strong updrafts near the storm cell might carry some rain drops on multiple trips up and down through the cloud, forming hail. Mature storms have frequent lightning, strong 34
The strong, gusty winds created Thunderstorm activity typically occur at the mature stage, when heavy rain falls. The rain drags air ing strong downdrafts. Sometimes these downbursts product damaging straight line winls of up to 150 miles J?»"^**££ colT^Is flowing out of In the dissipation stage, which ^^^^X. Rainfall diminishes, the storm cut off the storm's supply of warm, moist and the storm dies off.
atmosphere. There must be enough moisture to form clouds air that can cause rapidly and a lifting mechanism, such as a cold front strong 35 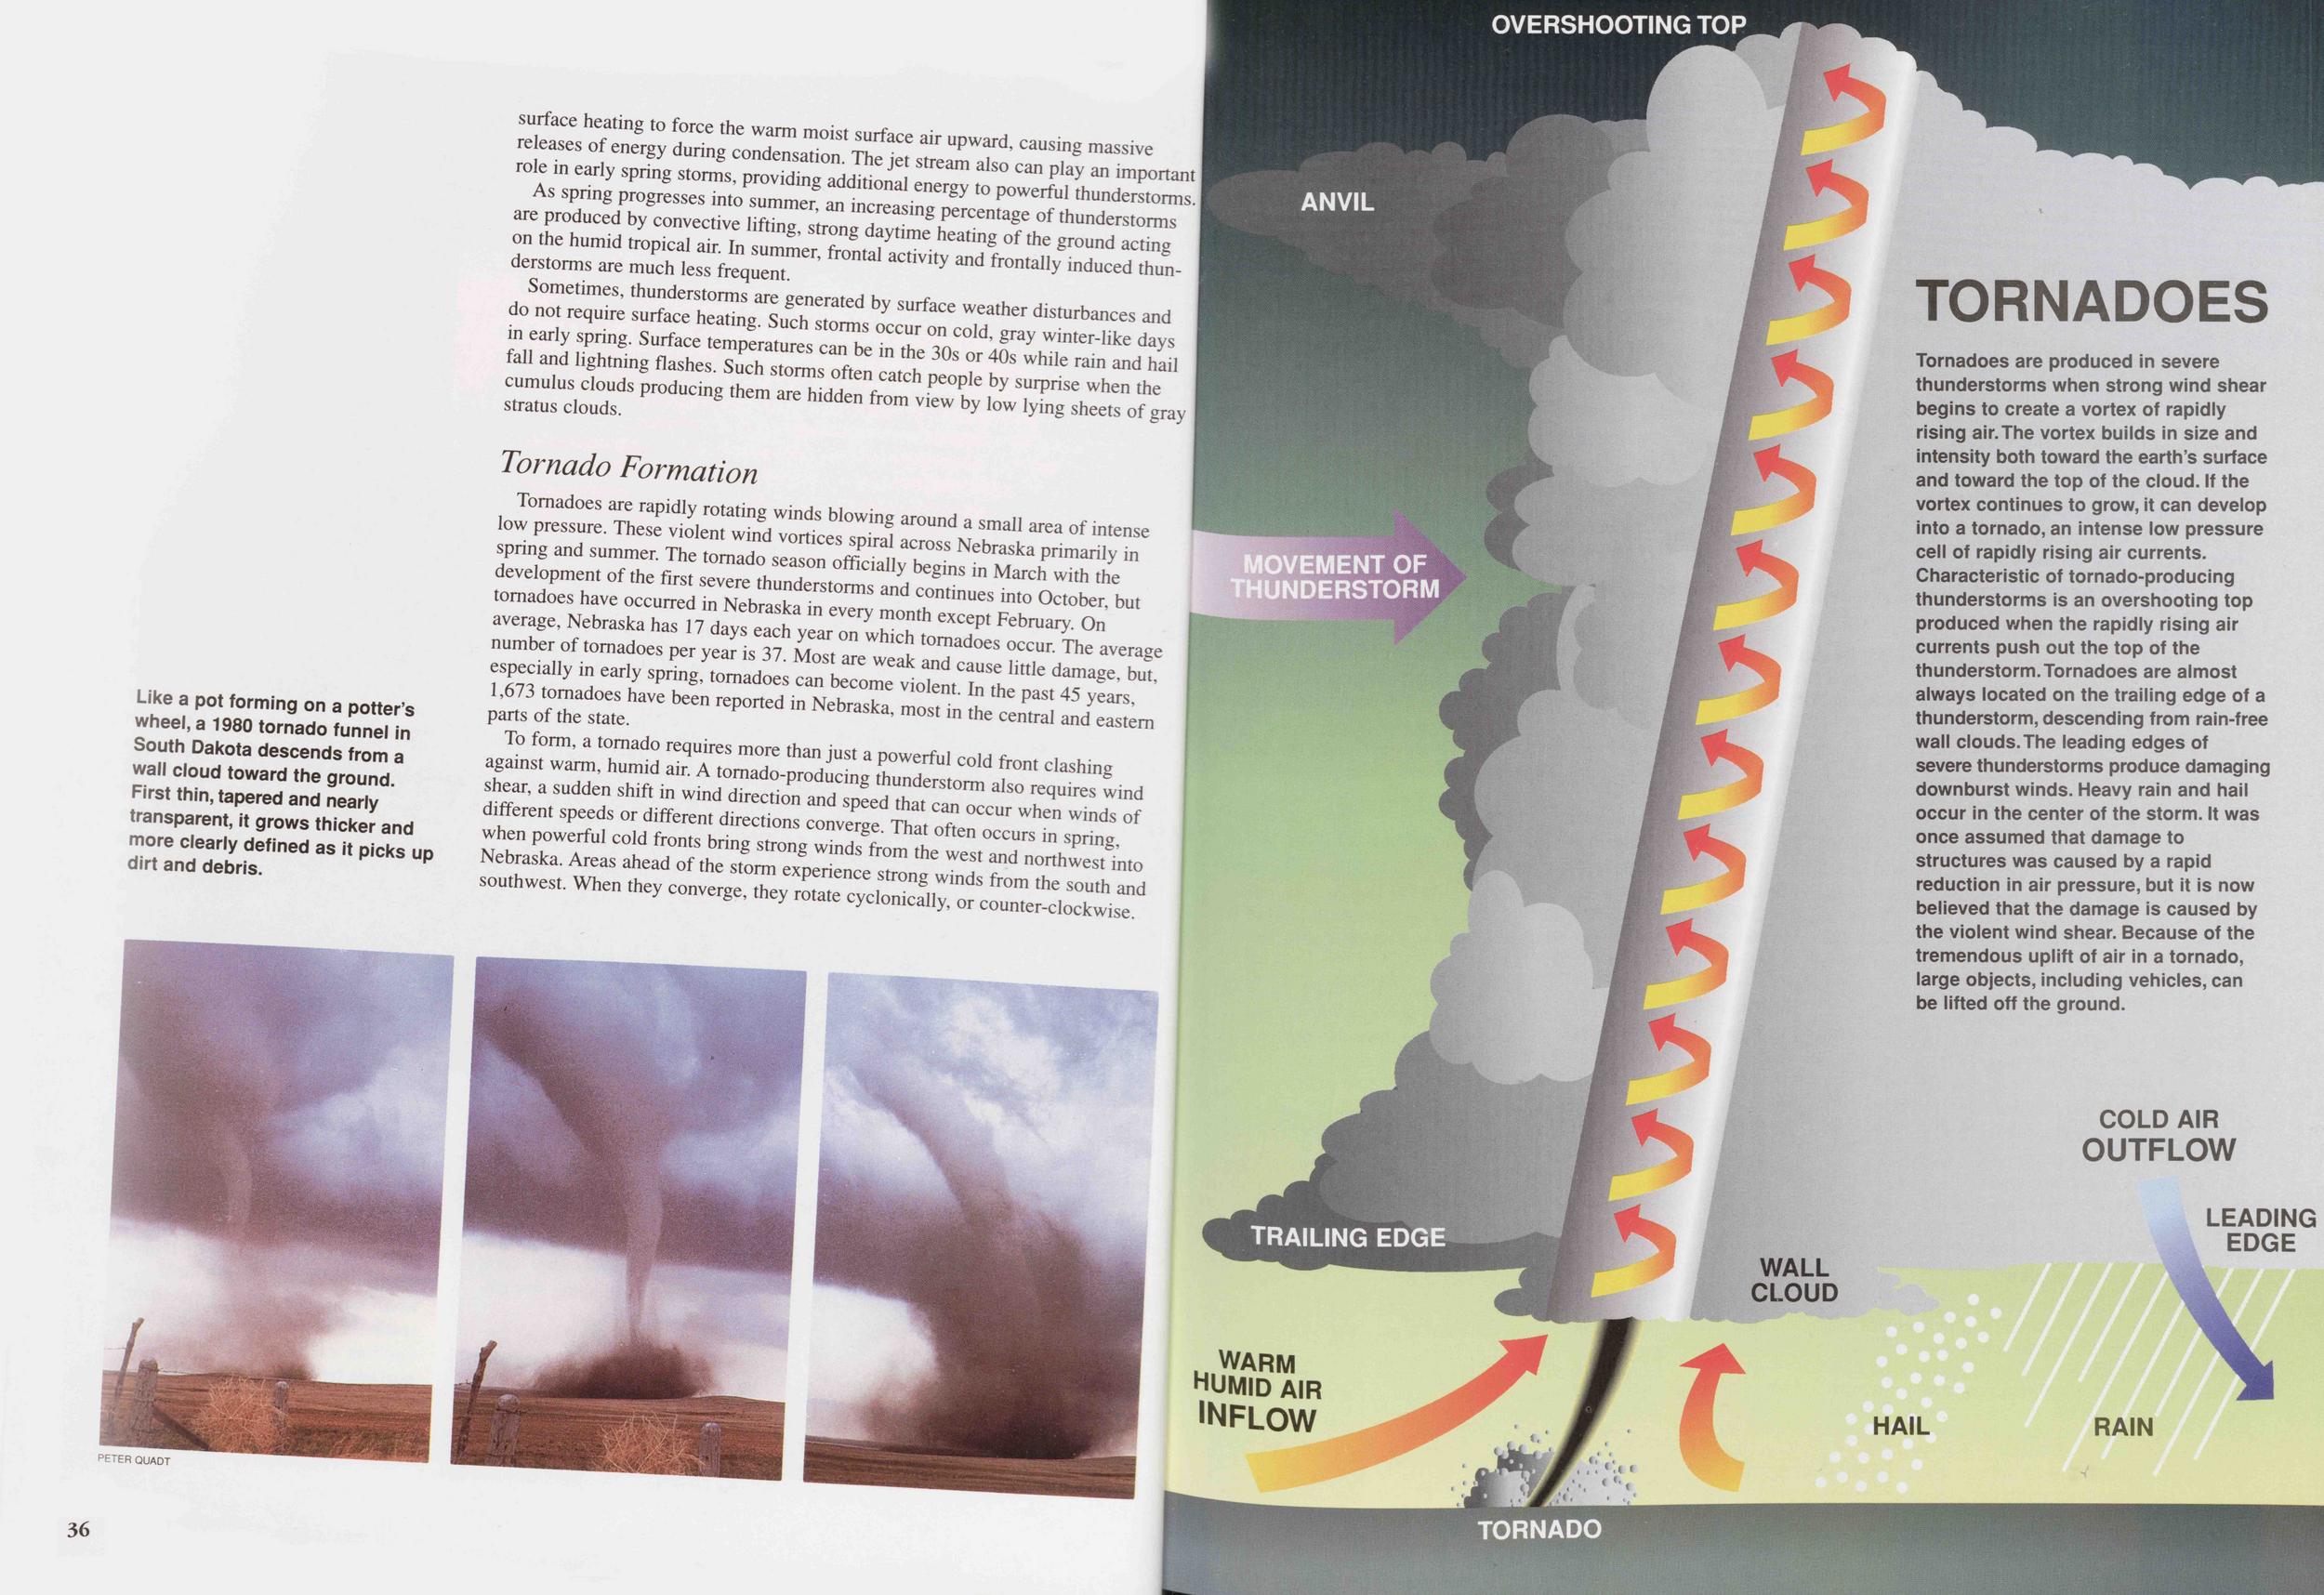 surface heating to force the warm moist surface air upward, causing massive releases of energy during condensation. The jet stream also can play an important role in early spring storms, providing additional energy to powerful thunderstorms.
As spring progresses into summer, an increasing percentage of thunderstorms are produced by convective lifting, strong daytime heating of the ground acting on the humid tropical air. In summer, frontal activity and frontally induced thunderstorms are much less frequent.
Sometimes, thunderstorms are generated by surface weather disturbances and do not require surface heating. Such storms occur on cold, gray winter-like days in early spring. Surface temperatures can be in the 30s or 40s while rain and hail fall and lightning flashes. Such storms often catch people by surprise when the cumulus clouds producing them are hidden from view by low lying sheets of gray stratus clouds.
spring and summer. The tone in development of the first severe storms with tornadoes have occurred m Nebraska in September to October but average, Nebraska has 17days each year in February On number of tornadoes per year s37£Z " ^t t0mad°es occur- The average especially in early spring tornados 1,673 tornadoes have been reported in Nebraska parts of the state. Nebraska, most in the central and eastern
shea,., sudden shift of wind afferent speeds or different. directions converge That when powerful cold fronts bring strong winds form in Nebraska. Areas ahead of the southwest.
36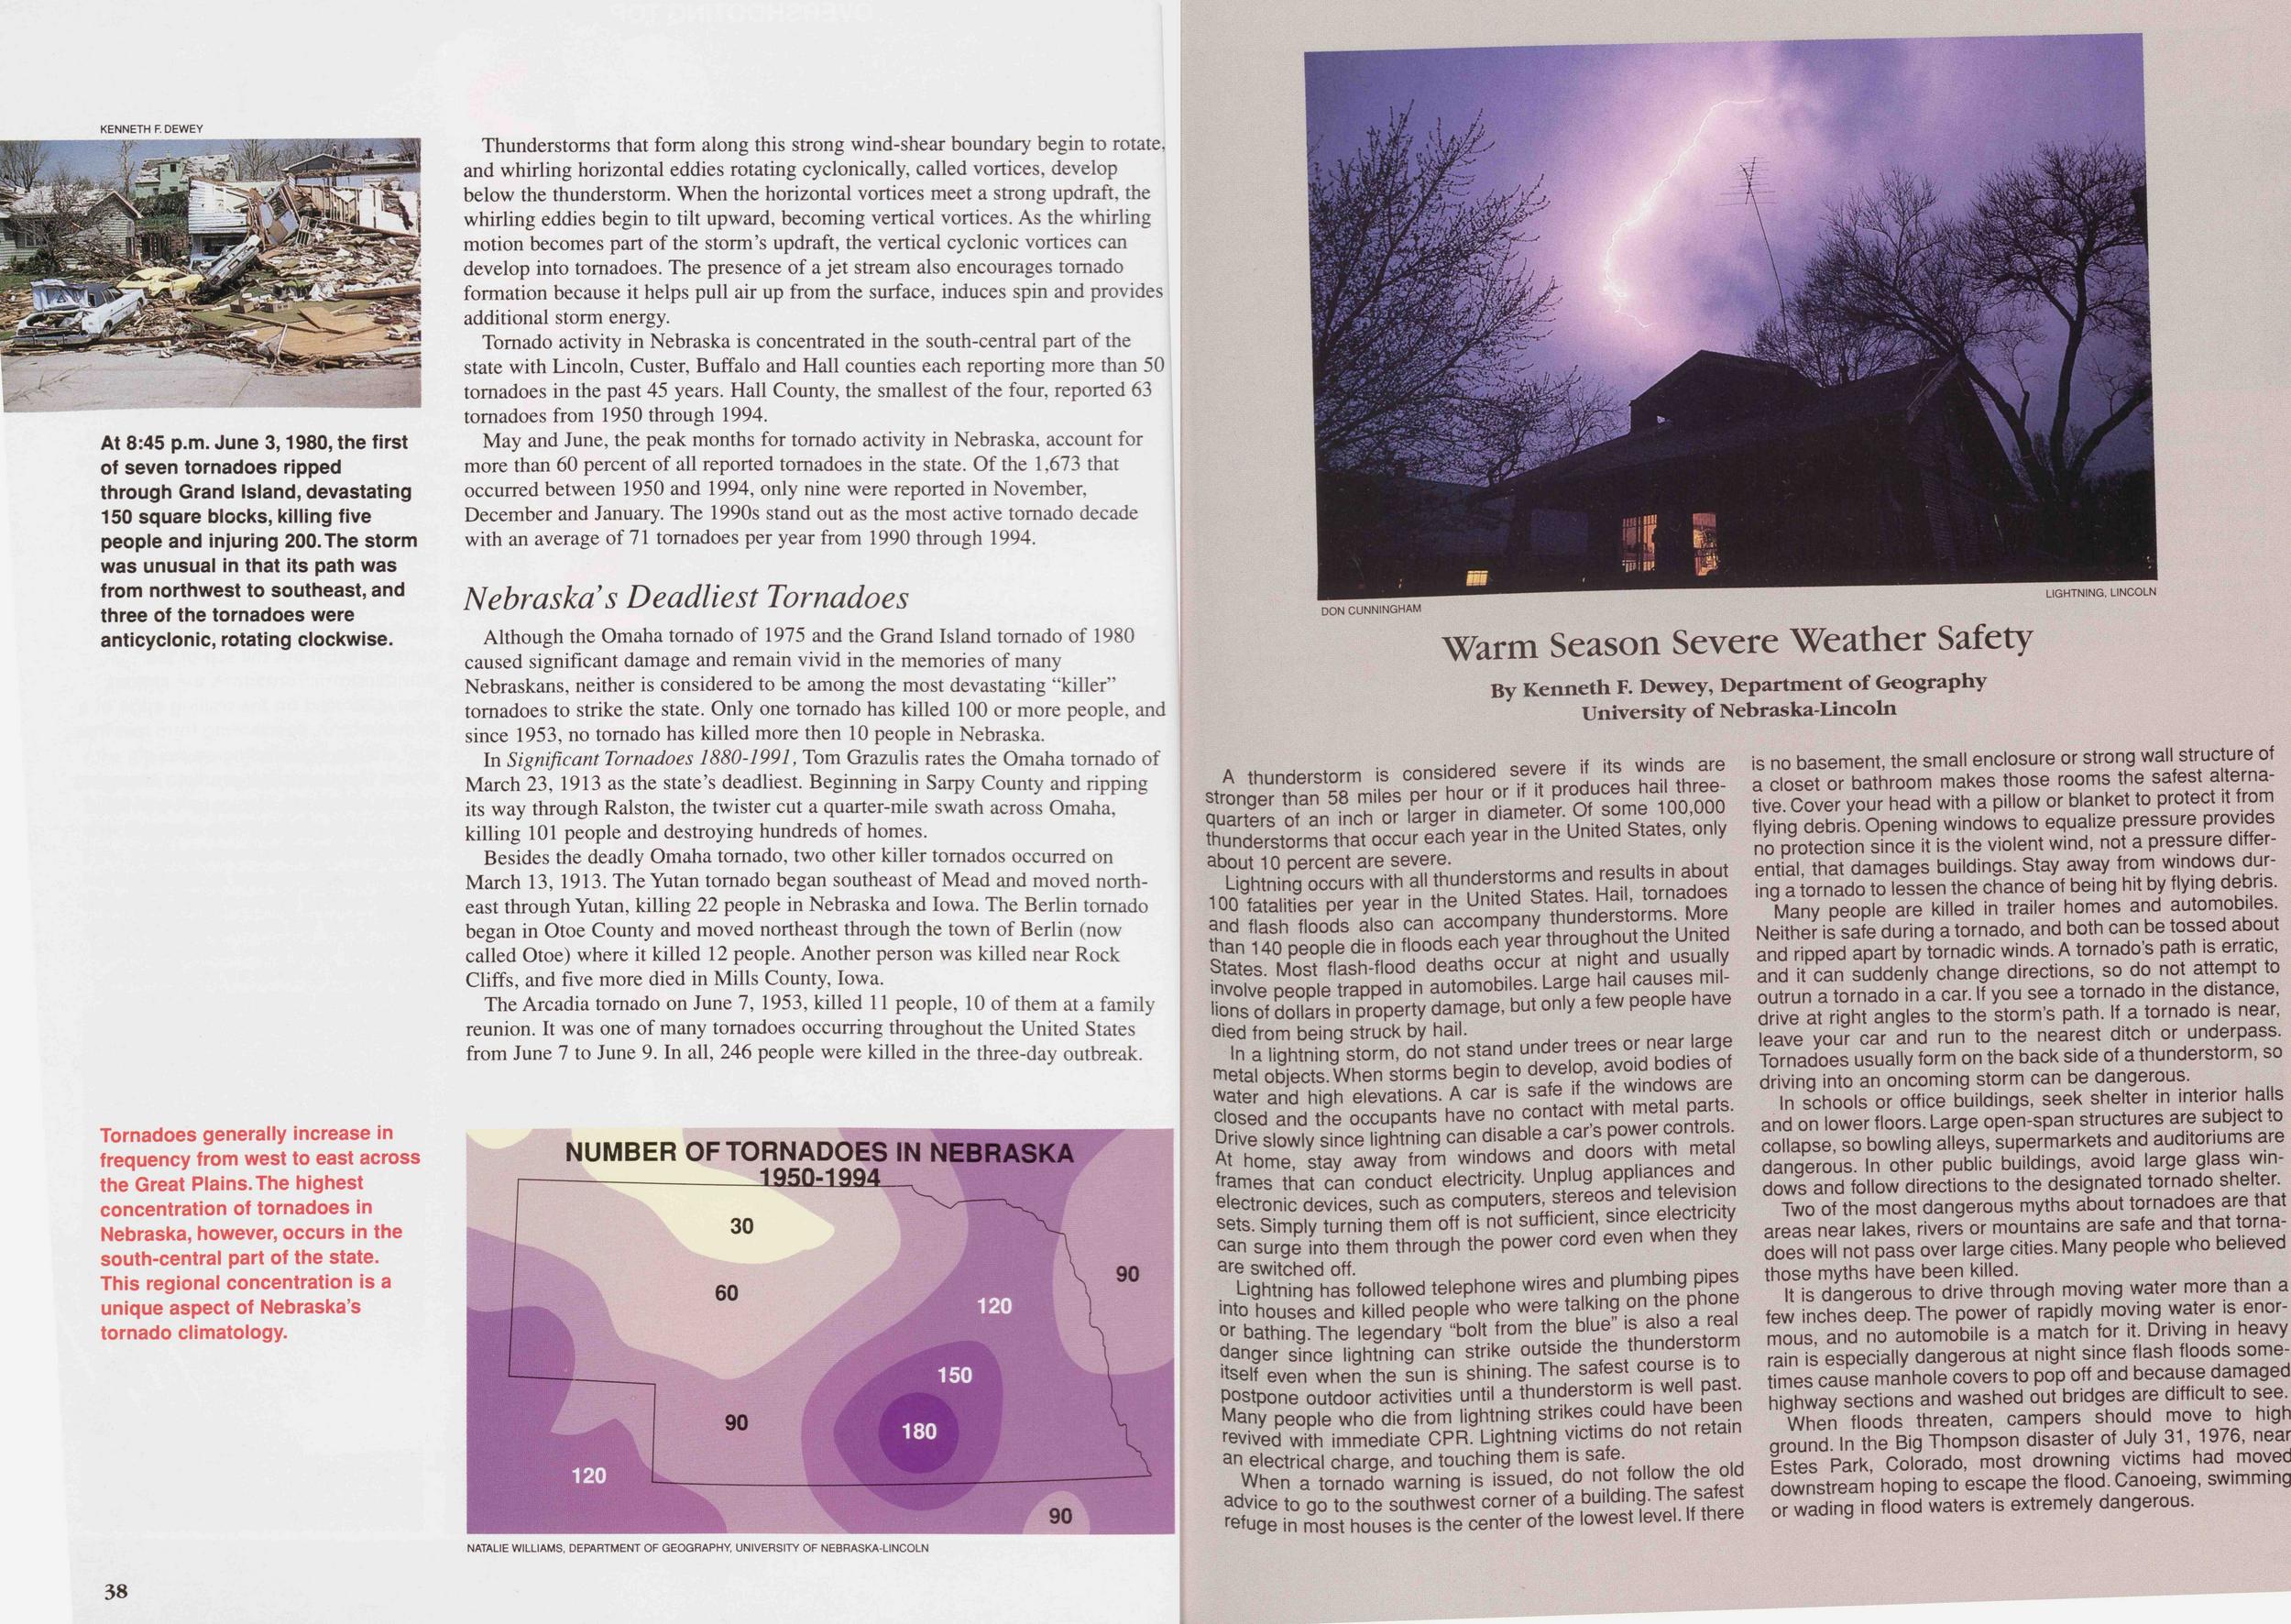
Thunderstorms that form along this strong wind-shear boundary begin to rotate, and whirling horizontal eddies rotating cyclonically, called vortices, develop below the thunderstorm. When the horizontal vortices meet a strong updraft, the whirling eddies begin to tilt upward, becoming vertical vortices. As the whirling motion becomes part of the storm's updraft, the vertical cyclonic vortices can develop into tornadoes. The presence of a jet stream also encourages tornado formation because it helps pull air up from the surface, induces spin and provides additional storm energy.
Tornado activity in Nebraska is concentrated in the south-central part of the state with Lincoln, Custer, Buffalo and Hall counties each reporting more than 50 tornadoes in the past 45 years. Hall County, the smallest of the four, reported 63 tornadoes from 1950 through 1994.
May and June, the peak months for tornado activity in Nebraska, account for more than 60 percent of all reported tornadoes in the state. Of the 1,673 that occurred between 1950 and 1994, only nine were reported in November, December and January. The 1990s stand out as the most active tornado decade with an average of 71 tornadoes per year from 1990 through 1994.
Nebraska s Deadliest TornadoesAlthough the Omaha tornado of 1975 and the Grand Island tornado of 1980 caused significant damage and remain vivid in the memories of many Nebraskans, neither is considered to be among the most devastating "killer" tornadoes to strike the state. Only one tornado has killed 100 or more people, and since 1953, no tornado has killed more then 10 people in Nebraska.
In Significant Tornadoes 1880-1991, Tom Grazulis rates the Omaha tornado of March 23, 1913 as the state's deadliest. Beginning in Sarpy County and ripping its way through Ralston, the twister cut a quarter-mile swath across Omaha, killing 101 people and destroying hundreds of homes.
Besides the deadly Omaha tornado, two other killer tornados occurred on March 13, 1913. The Yutan tornado began southeast of Mead and moved northeast through Yutan, killing 22 people in Nebraska and Iowa. The Berlin tornado began in Otoe County and moved northeast through the town of Berlin (now called Otoe) where it killed 12 people. Another person was killed near Rock Cliffs, and five more died in Mills County, Iowa.
The Arcadia tornado on June 7, 1953, killed 11 people, 10 of them at a family reunion. It was one of many tornadoes occurring throughout the United States from June 7 to June 9. In all, 246 people were killed in the three-day outbreak.
38A thunderstorm is considered severe if its winds are stronger than 58 miles per hour or if it has three- quarters of an inch or larger in the thunderstorms that occur each year in the United States, only about 10 percent are severe.
Lightning occurs with all thunderstorms and result in 100 fatalities per year in the United States. Hail, tornadoes and floods also can accompany than 140 people die in floods each year throughout the United States. Most flash-flood deaths occur and involve people trapped in automobiles. Large hail causes mil lions of dSs in property damage, but only a few people have died from being struck by hail.
In a lightning storm, do not stand under treesiorrjartoj metal objects When storms begin to develop, avoid bodies of water and high elevations. A car is safe if the roads closed and the occupants have no contact with metal pars. Drive slowly since lightning can disable a line. At home, stay away from windows and doors frames that can conduct electricity. Unplug electronic devices, such as computers stereos and tension sets. Simply turning them off is not sufficient, electricity can surge into them through the power cord even when they ere switched off.
Lightning has followed telephone wires and plumbing pipes into houses and killed people who were talking on the phone or bathing. The legendary "bolt from the blue is danger since lightning can strike outside the• thunderstorm itself even when the sun is shining. The safest course is to Postpone outdoor activities until a thunderstorm is well past Many people who die from lightning strikes could have been revived with immediate CPR. Lightning victims do not retain an electrical charge, and touching them is sate.
When a tornado warning is issued, do not follow the old advice to go to the southwest corner of a building.The safest refuge in most houses is the center of the lowest level. If there is no basement, the small enclosure or strong wall structure of a closet or bathroom makes those rooms the safest alternative. Cover your head with a pillow or blanket to protect it from flying debris. Opening windows to equalize pressure provides no protection since it is the violent wind, not a pressure differential, that damages buildings. Stay away from windows during a tornado to lessen the chance of being hit by flying debris.
Many people are killed in trailer homes and automobiles. Neither is safe during a tornado, and both can be tossed about and ripped apart by tornadic winds. A tornado's path is erratic, and it can suddenly change directions, so do not attempt to outrun a tornado in a car. If you see a tornado in the distance, drive at right angles to the storm's path. If a tornado is near, leave your car and run to the nearest ditch or underpass. Tornadoes usually form on the back side of a thunderstorm, so driving into an oncoming storm can be dangerous.
In schools or office buildings, seek shelter in interior halls and on lower floors. Large open-span structures are subject to collapse, so bowling alleys, supermarkets and auditoriums are dangerous. In other public buildings, avoid large glass windows and follow directions to the designated tornado shelter.
Two of the most dangerous myths about tornadoes are that areas near lakes, rivers or mountains are safe and that tornadoes will not pass over large cities. Many people who believed those myths have been killed.
It is dangerous to drive through moving water more than a few inches deep. The power of rapidly moving water is enormous, and no automobile is a match for it. Driving in heavy rain is especially dangerous at night since flash floods sometimes cause manhole covers to pop off and because damaged highway sections and washed out bridges are difficult to see.
When floods threaten, campers should move to high ground. In the Big Thompson disaster of July 31, 1976, near Estes Park, Colorado, most drowning victims had moved downstream hoping to escape the flood. Canoeing, swimming or wading in flood waters is extremely dangerous.
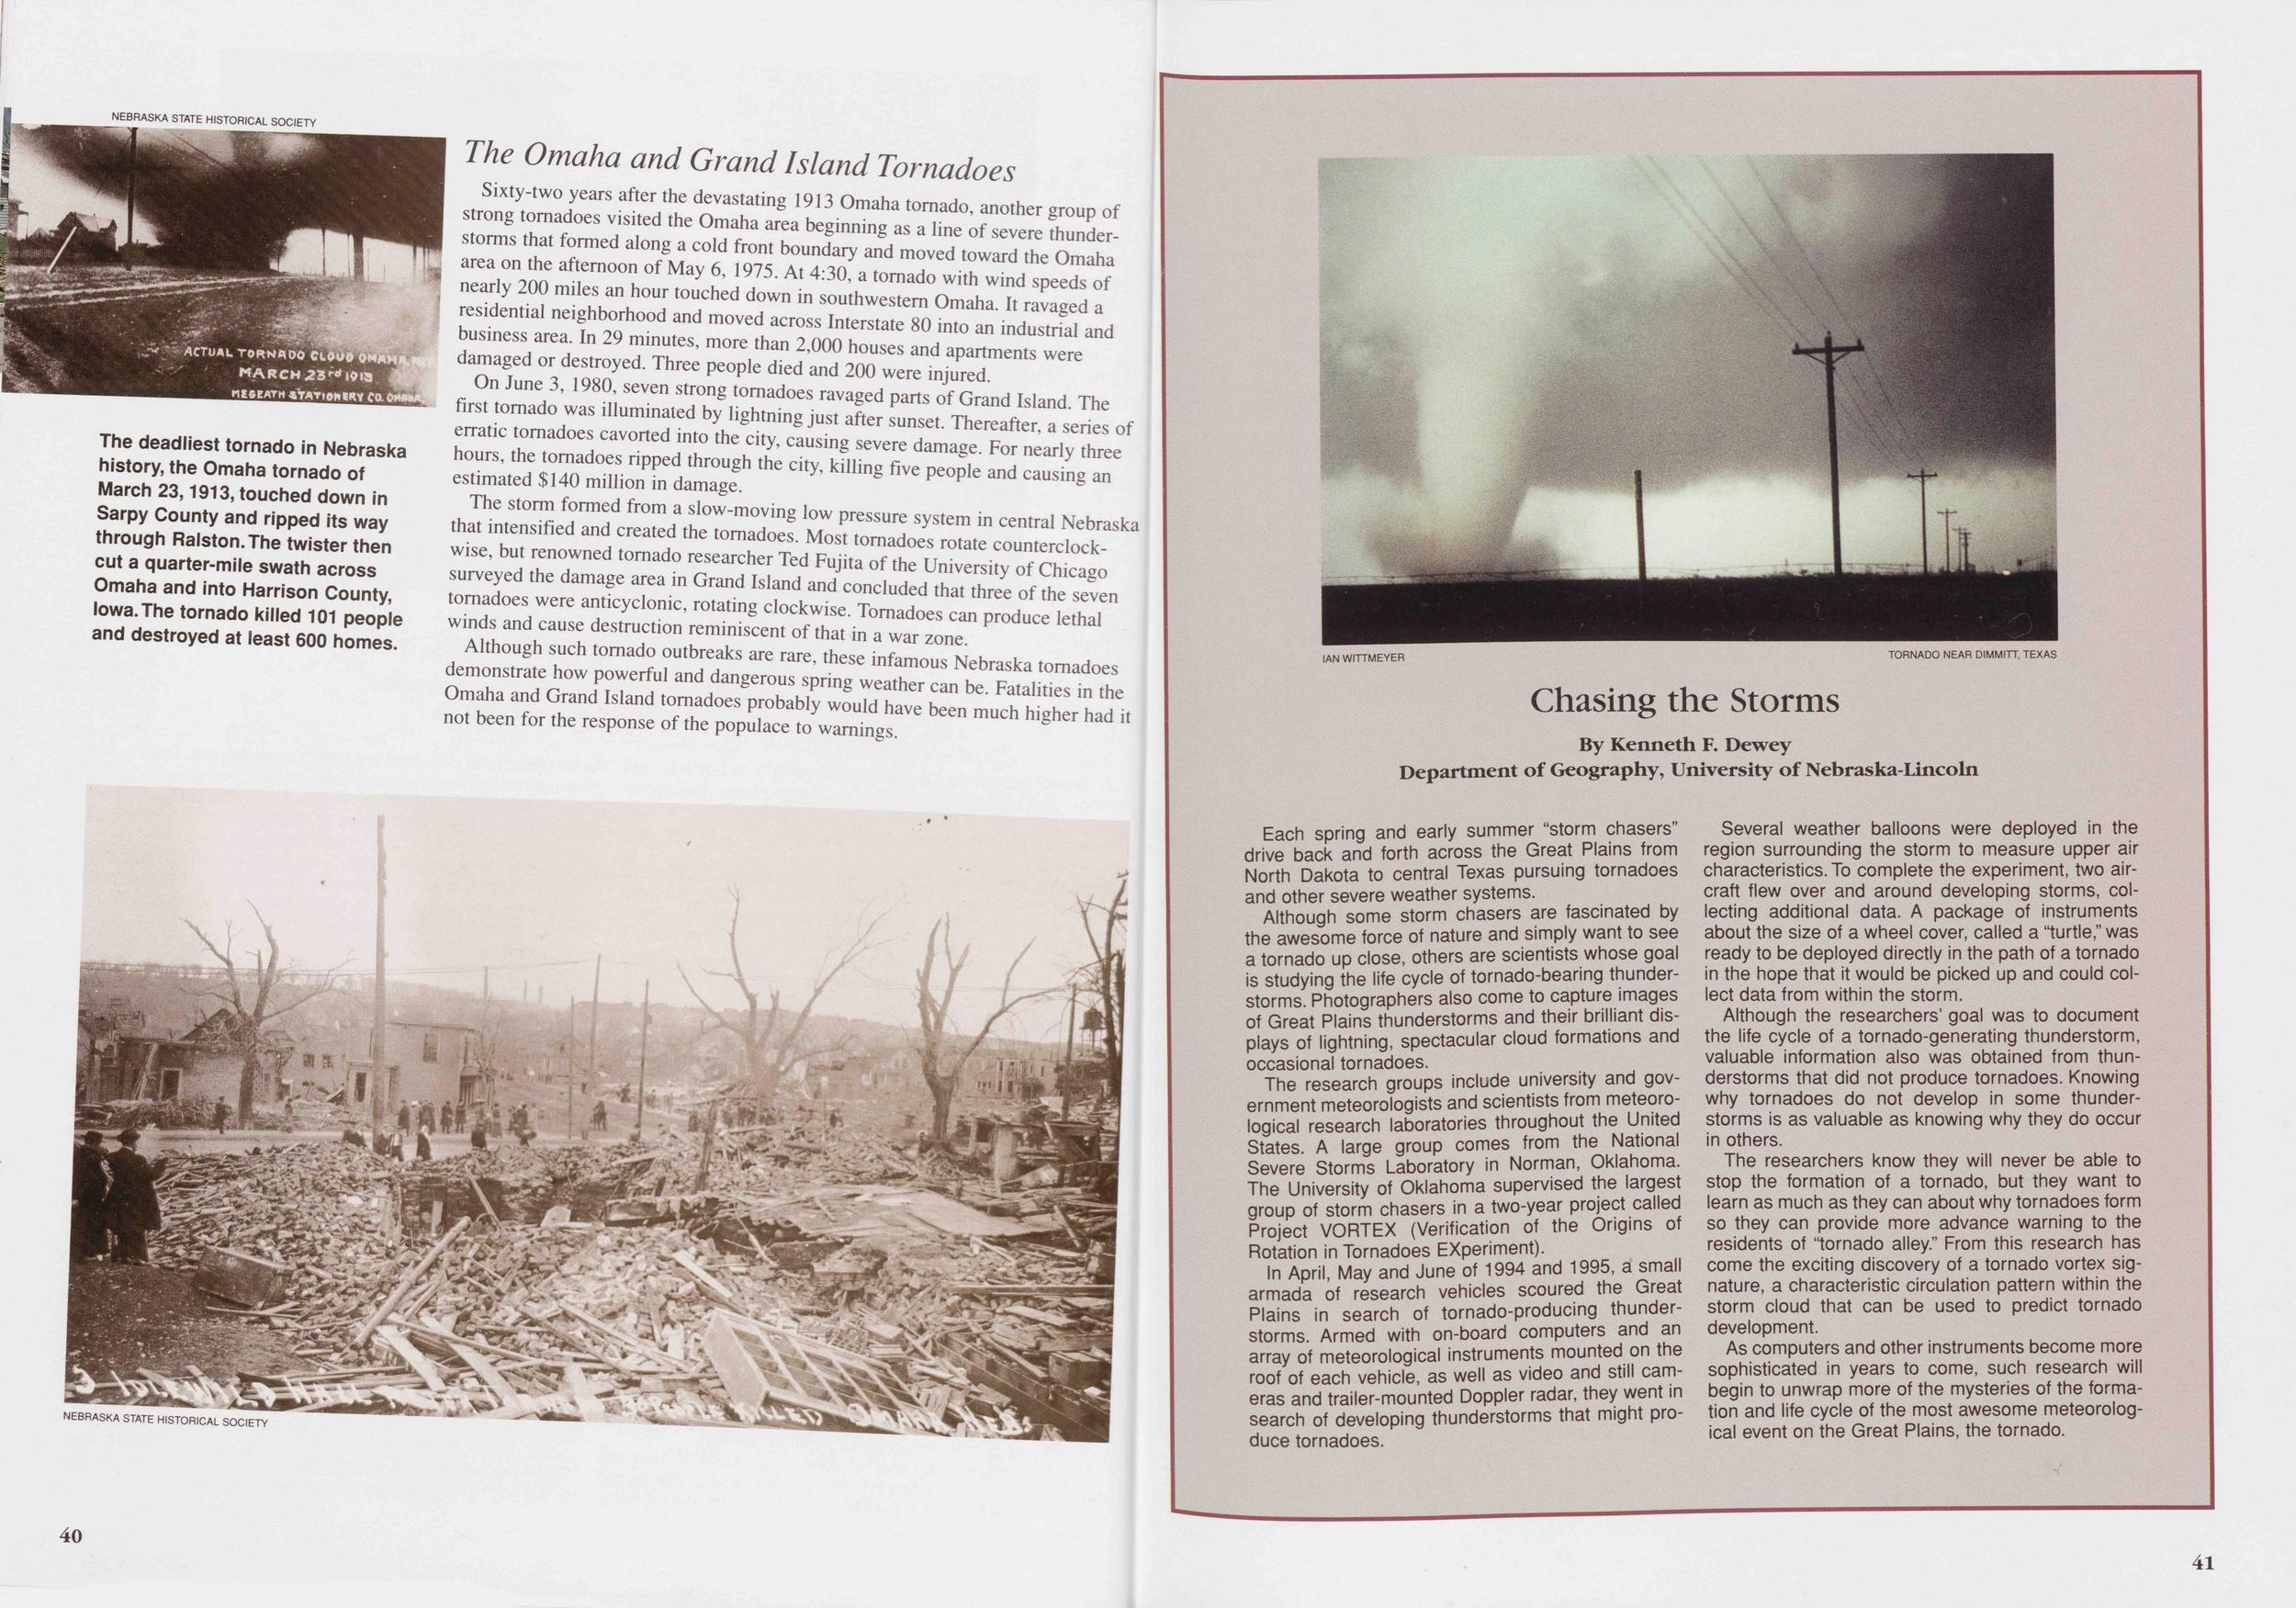
Sixty-two years after the devastating 1913 Omaha tornado, another group of strong tornadoes visited the Omaha area beginning as a line of severe thunderstorms that formed along a cold front boundary and moved toward the Omaha area on the afternoon of May 6, 1975. At 4:30, a tornado with wind speeds of nearly 200 miles an hour touched down in southwestern Omaha. It ravaged a residential neighborhood and moved across Interstate 80 into an industrial and business area. In 29 minutes, more than 2,000 houses and apartments were damaged or destroyed. Three people died and 200 were injured.
On June 3, 1980, seven strong tornadoes ravaged parts of Grand Island. The first tornado was illuminated by lightning just after sunset. Thereafter, a series of erratic tornadoes cavorted into the city, causing severe damage. For nearly three hours, the tornadoes ripped through the city, killing five people and causing an estimated $140 million in damage.
The storm formed from a slow-moving low pressure system in central Nebraska that intensified and created the tornadoes. Most tornadoes rotate counter clock- wise, but renowned tornado researcher Ted Fujita of the University of Chicago surveyed the damage area in Grand Island and concluded that three of the seven tornadoes were anticyclonic, rotating clockwise. Tornadoes can produce lethal winds and cause destruction reminiscent of that in a war zone.
Although such tornado outbreaks are rare, these infamous Nebraska tornadoes demonstrate how powerful and dangerous spring weather can be. Fatalities in the Omaha and Grand Island tornadoes probably would have been much higher had it not been for the response of the populace to warnings.
Each spring and early summer "storm chasers" drive back and forth across the Great Plains from North Dakota to central Texas pursuing tornadoes and other severe weather systems.
Although some storm chasers are fascinated by the awesome force of nature and simply want to see a tornado up close, others are scientists whose goal is studying the life cycle of tornado-bearing thunderstorms. Photographers also come to capture images of Great Plains thunderstorms and their brilliant displays of lightning, spectacular cloud formations and occasional tornadoes.
The research groups include university and government meteorologists and scientists from meteorological research laboratories throughout the United States. A large group comes from the National Severe Storms Laboratory in Norman, Oklahoma. The University of Oklahoma supervised the largest group of storm chasers in a two-year project called Project VORTEX (Verification of the Origins of Rotation in Tornadoes Experiment).
In April, May and June of 1994 and 1995, a small armada of research vehicles scoured the Great Plains in search of tornado-producing thunderstorms. Armed with on-board computers and an array of meteorological instruments mounted on the roof of each vehicle, as well as video and still cameras and trailer-mounted Doppler radar, they went in search of developing thunderstorms that might produce tornadoes.
Several weather balloons were deployed in the region surrounding the storm to measure upper air characteristics. To complete the experiment, two aircraft flew over and around developing storms, collecting additional data. A package of instruments about the size of a wheel cover, called a "turtle," was ready to be deployed directly in the path of a tornado in the hope that it would be picked up and could collect data from within the storm.
Although the researchers' goal was to document the life cycle of a tornado-generating thunderstorm, valuable information also was obtained from thunderstorms that did not produce tornadoes. Knowing why tornadoes do not develop in some thunderstorms is as valuable as knowing why they do occur in others.
The researchers know they will never be able to stop the formation of a tornado, but they want to learn as much as they can about why tornadoes form so they can provide more advance warning to the residents of "tornado alley." From this research has come the exciting discovery of a tornado vortex signature, a characteristic circulation pattern within the storm cloud that can be used to predict tornado development.
As computers and other instruments become more sophisticated in years to come, such research will begin to unwrap more of the mysteries of the formation and life cycle of the most awesome meteorological event on the Great Plains, the tornado.
41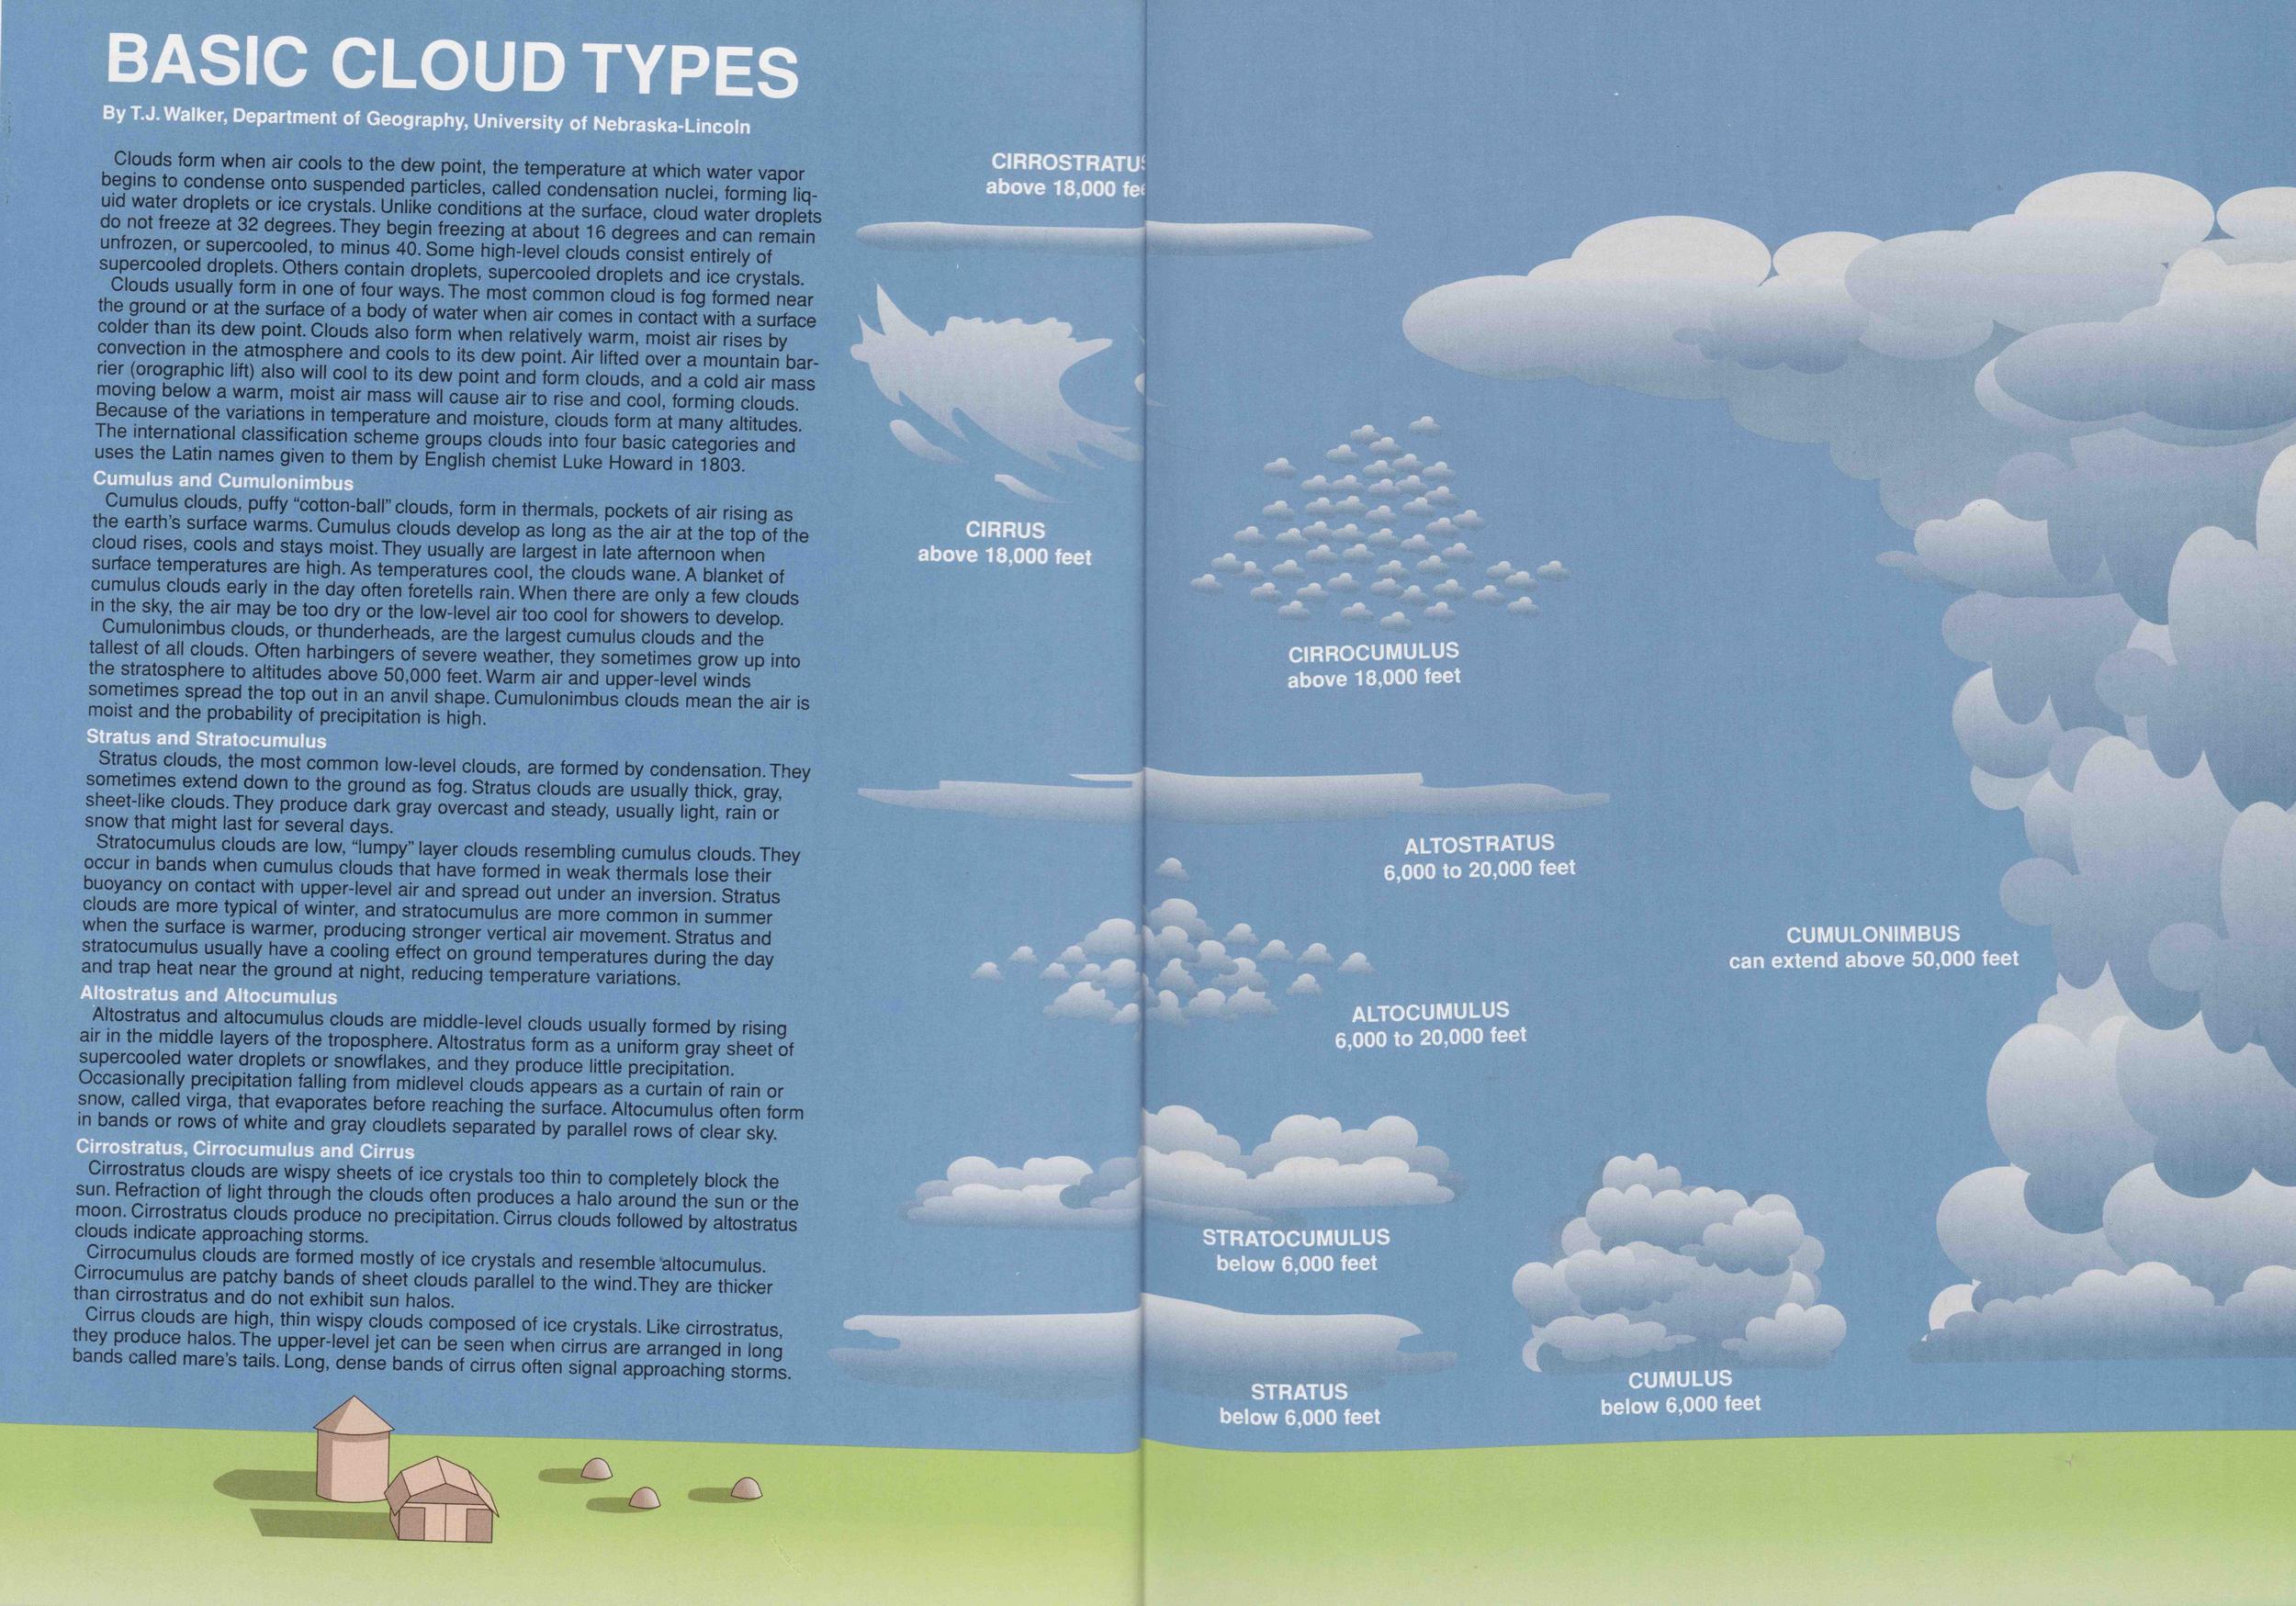 BASIC CLOUD TYPES ment of Geography, University of Nebraska-Lincoln
Clouds form when air cools to the dew point, the temperature at which water vapor begins to condense onto suspended particles, called condensation nuclei, forming liquid water droplets or ice crystals. Unlike conditions at the surface, cloud water droplets do not freeze at 32 degrees. They begin freezing at about 16 degrees and can remain unfrozen, or supercooled, to minus 40. Some high-level clouds consist entirely of supercooled droplets. Others contain droplets, supercooled droplets and ice crystals.
Clouds usually form in one of four ways. The most common cloud is fog formed near the ground or at the surface of a body of water when air comes in contact with a surface colder than its dew point. Clouds also form when relatively warm, moist air rises by convection in the atmosphere and cools to its dew point. Air lifted over a mountain barrier (orographic lift) also will cool to its dew point and form clouds, and a cold air mass moving below a warm, moist air mass will cause air to rise and cool, forming clouds. Because of the variations in temperature and moisture, clouds form at many altitudes. The international classification scheme groups clouds into four basic categories and uses the Latin names given to them by English chemist Luke Howard in 1803.
Cumulus clouds, puffy "cotton-ball" clouds, form in thermals, pockets of air rising as the earth's surface warms. Cumulus clouds develop as long as the air at the top of the cloud rises, cools and stays moist. They usually are largest in late afternoon when surface temperatures are high. As temperatures cool, the clouds wane. A blanket of cumulus clouds early in the day often foretells rain. When there are only a few clouds in the sky, the air may be too dry or the low-level air too cool for showers to develop.
Cumulonimbus clouds, or thunderheads, are the largest cumulus clouds and the tallest of all clouds. Often harbingers of severe weather, they sometimes grow up into the stratosphere to altitudes above 50,000 feet. Warm air and upper-level winds sometimes spread the top out in an anvil shape. Cumulonimbus clouds mean the air is moist and the probability of precipitation is high.
Stratus clouds, the most common low-level clouds, are formed by condensation. They sometimes extend down to the ground as fog. Stratus clouds are usually thick, gray, sheet-like clouds. They produce dark gray overcast and steady, usually light, rain or snow that might last for several days.
Stratocumulus clouds are low, "lumpy" layer clouds resembling cumulus clouds. They occur in bands when cumulus clouds that have formed in weak thermals lose their buoyancy on contact with upper-level air and spread out under an inversion. Stratus clouds are more typical of winter, and stratocumulus are more common in summer when the surface is warmer, producing stronger vertical air movement. Stratus and stratocumulus usually have a cooling effect on ground temperatures during the day and trap heat near the ground at night, reducing temperature variations.
Altostratus and altocumulus clouds are middle-level clouds usually formed by rising air in the middle layers of the troposphere. Altostratus form as a uniform gray sheet of supercooled water droplets or snowflakes, and they produce little precipitation. Occasionally precipitation falling from midlevel clouds appears as a curtain of rain or snow, called virga, that evaporates before reaching the surface. Altocumulus often form in bands or rows of white and gray cloudlets separated by parallel rows of clear sky.
Cirrostratus clouds are wispy sheets of ice crystals too thin to completely block the sun. Refraction of light through the clouds often produces a halo around the sun or the moon. Cirrostratus clouds produce no precipitation. Cirrus clouds followed by altostratus clouds indicate approaching storms.
Cirrocumulus clouds are formed mostly of ice crystals and resemble altocumulus. Cirrocumulus are patchy bands of sheet clouds parallel to the wind.They are thicker than cirrostratus and do not exhibit sun halos.
Cirrus clouds are high, thin wispy clouds composed of ice crystals. Like cirrostratus, they produce halos. The upper-level jet can be seen when cirrus are arranged in long bands called mare's tails. Long, dense bands of cirrus often signal approaching storms.
Summer
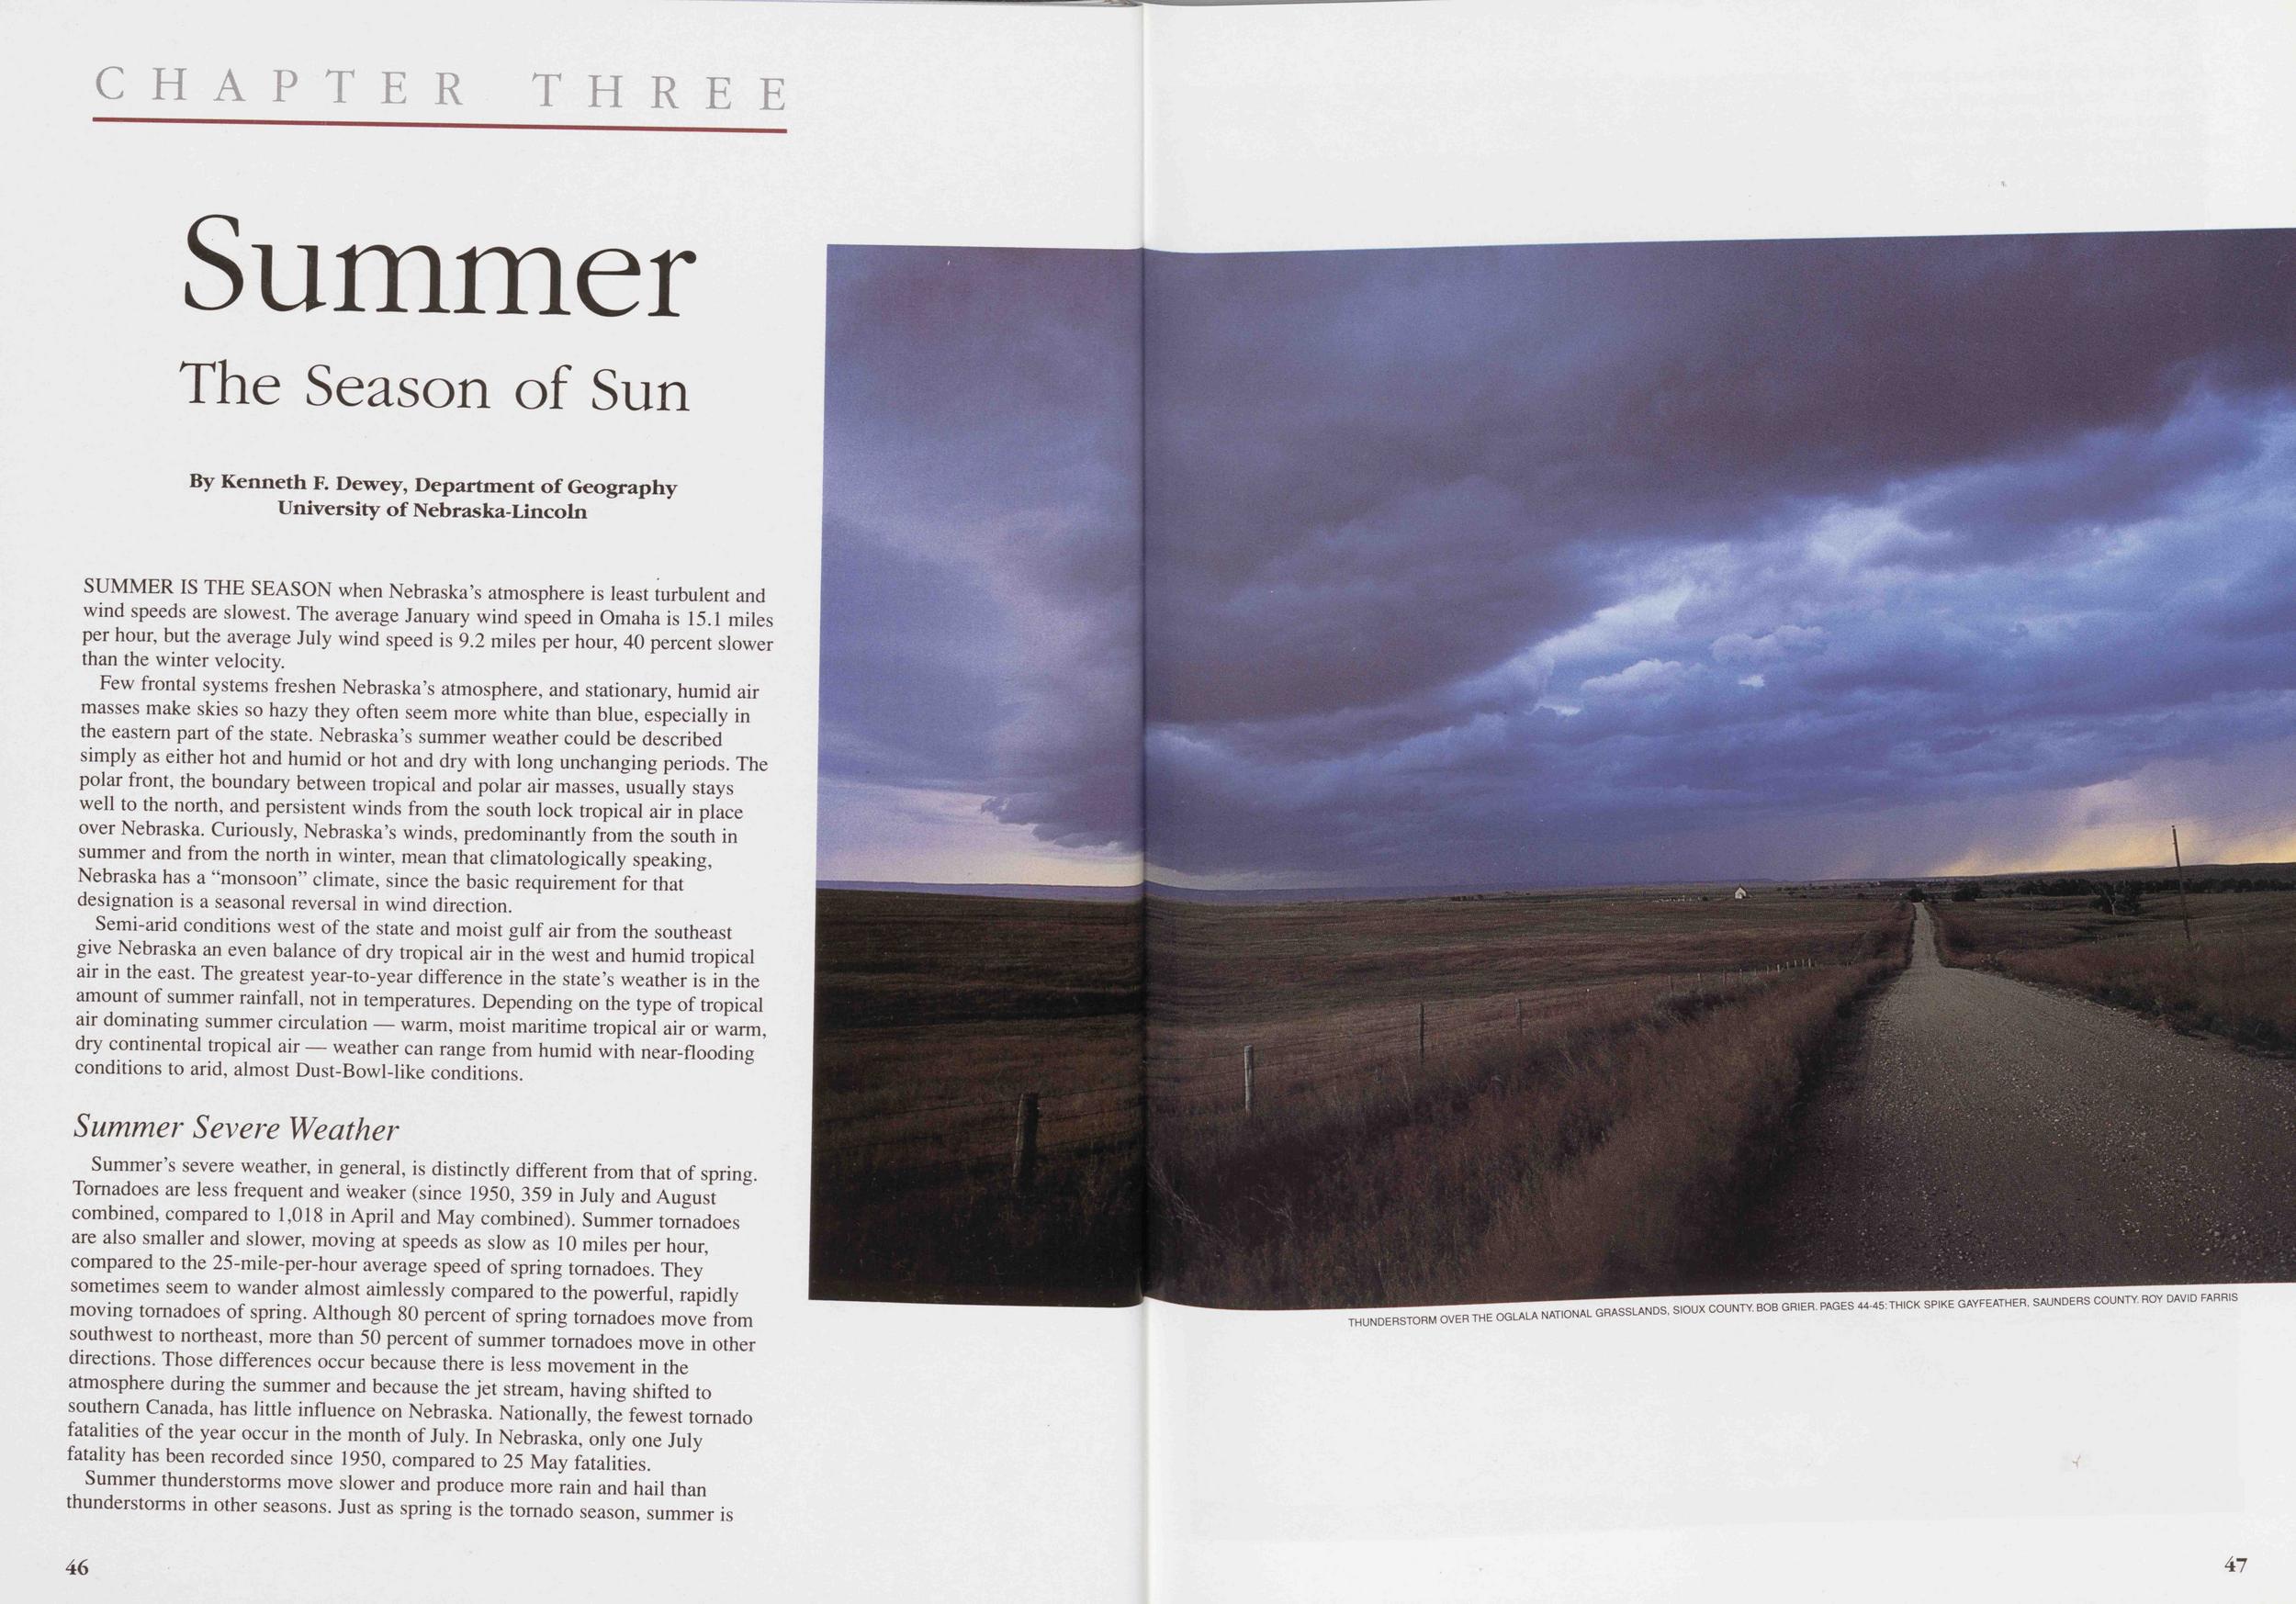
The Season of Sun
By Kenneth F. Dewey, Department of Geography University of Nebraska-LincolnSUMMER IS THE SEASON when Nebraska's atmosphere is least turbulent and wind speeds are slowest. The average January wind speed in Omaha is 15.1 miles per hour, but the average July wind speed is 9.2 miles per hour, 40 percent slower than the winter velocity.
Few frontal systems freshen Nebraska's atmosphere, and stationary, humid air masses make skies so hazy they often seem more white than blue, especially in the eastern part of the state. Nebraska's summer weather could be described simply as either hot and humid or hot and dry with long unchanging periods. The polar front, the boundary between tropical and polar air masses, usually stays well to the north, and persistent winds from the south lock tropical air in place over Nebraska. Curiously, Nebraska's winds, predominantly from the south in summer and from the north in winter, mean that climatologically speaking, Nebraska has a "monsoon" climate, since the basic requirement for that designation is a seasonal reversal in wind direction.
Semi-arid conditions west of the state and moist gulf air from the southeast give Nebraska an even balance of dry tropical air in the west and humid tropical air in the east. The greatest year-to-year difference in the state's weather is in the amount of summer rainfall, not in temperatures. Depending on the type of tropical air dominating summer circulation — warm, moist maritime tropical air or warm, dry continental tropical air — weather can range from humid with near-flooding conditions to arid, almost Dust-Bowl-like conditions.
Summer Severe WeatherSummer's severe weather, in general, is distinctly different from that of spring. Tornadoes are less frequent and weaker (since 1950, 359 in July and August combined, compared to 1,018 in April and May combined). Summer tornadoes are also smaller and slower, moving at speeds as slow as 10 miles per hour, compared to the 25-mile-per-hour average speed of spring tornadoes. They sometimes seem to wander almost aimlessly compared to the powerful, rapidly moving tornadoes of spring. Although 80 percent of spring tornadoes move from southwest to northeast, more than 50 percent of summer tornadoes move in other directions. Those differences occur because there is less movement in the atmosphere during the summer and because the jet stream, having shifted to southern Canada, has little influence on Nebraska. Nationally, the fewest tornado fatalities of the year occur in the month of July. In Nebraska, only one July fatality has been recorded since 1950, compared to 25 May fatalities.
Summer thunderstorms move slower and produce more rain and hail than thunderstorms in other seasons. Just as spring is the tornado season, summer is 46
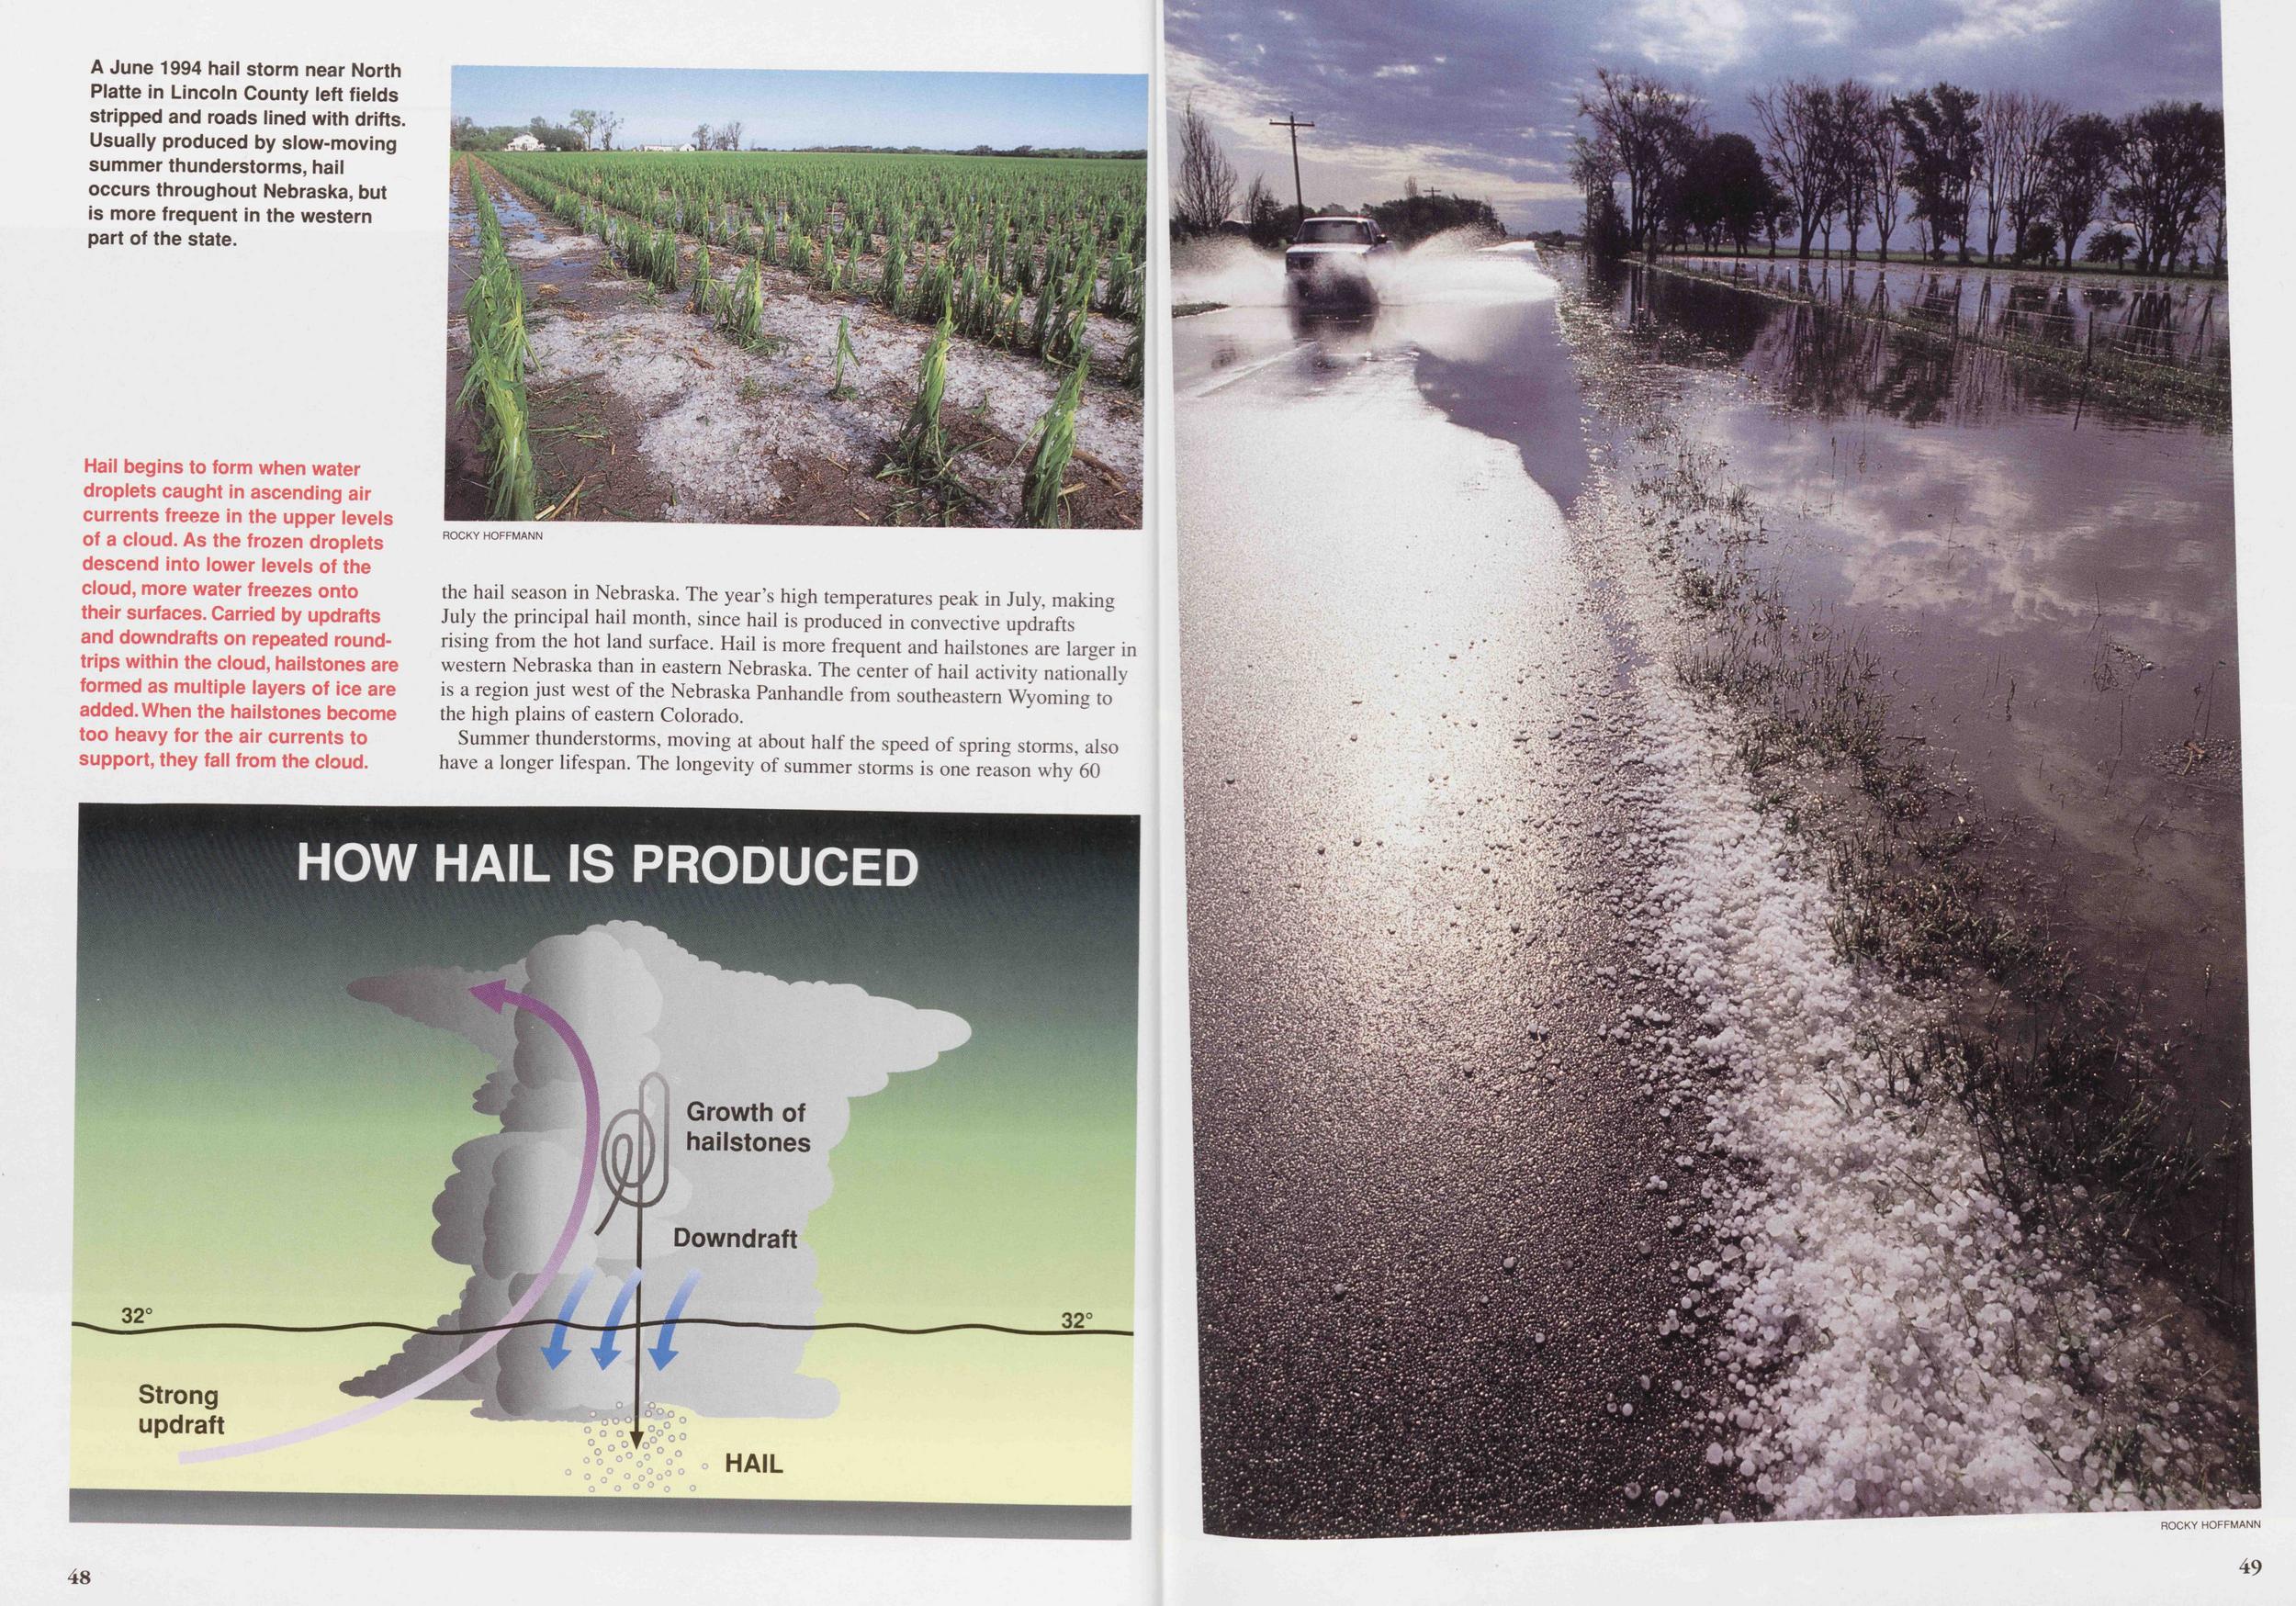
Summer thunderstorms, moving at about half the speed of spring storms, also have a longer lifespan. The longevity of summer storms is one reason why 60 48
Thunderstorm Fire and Ice
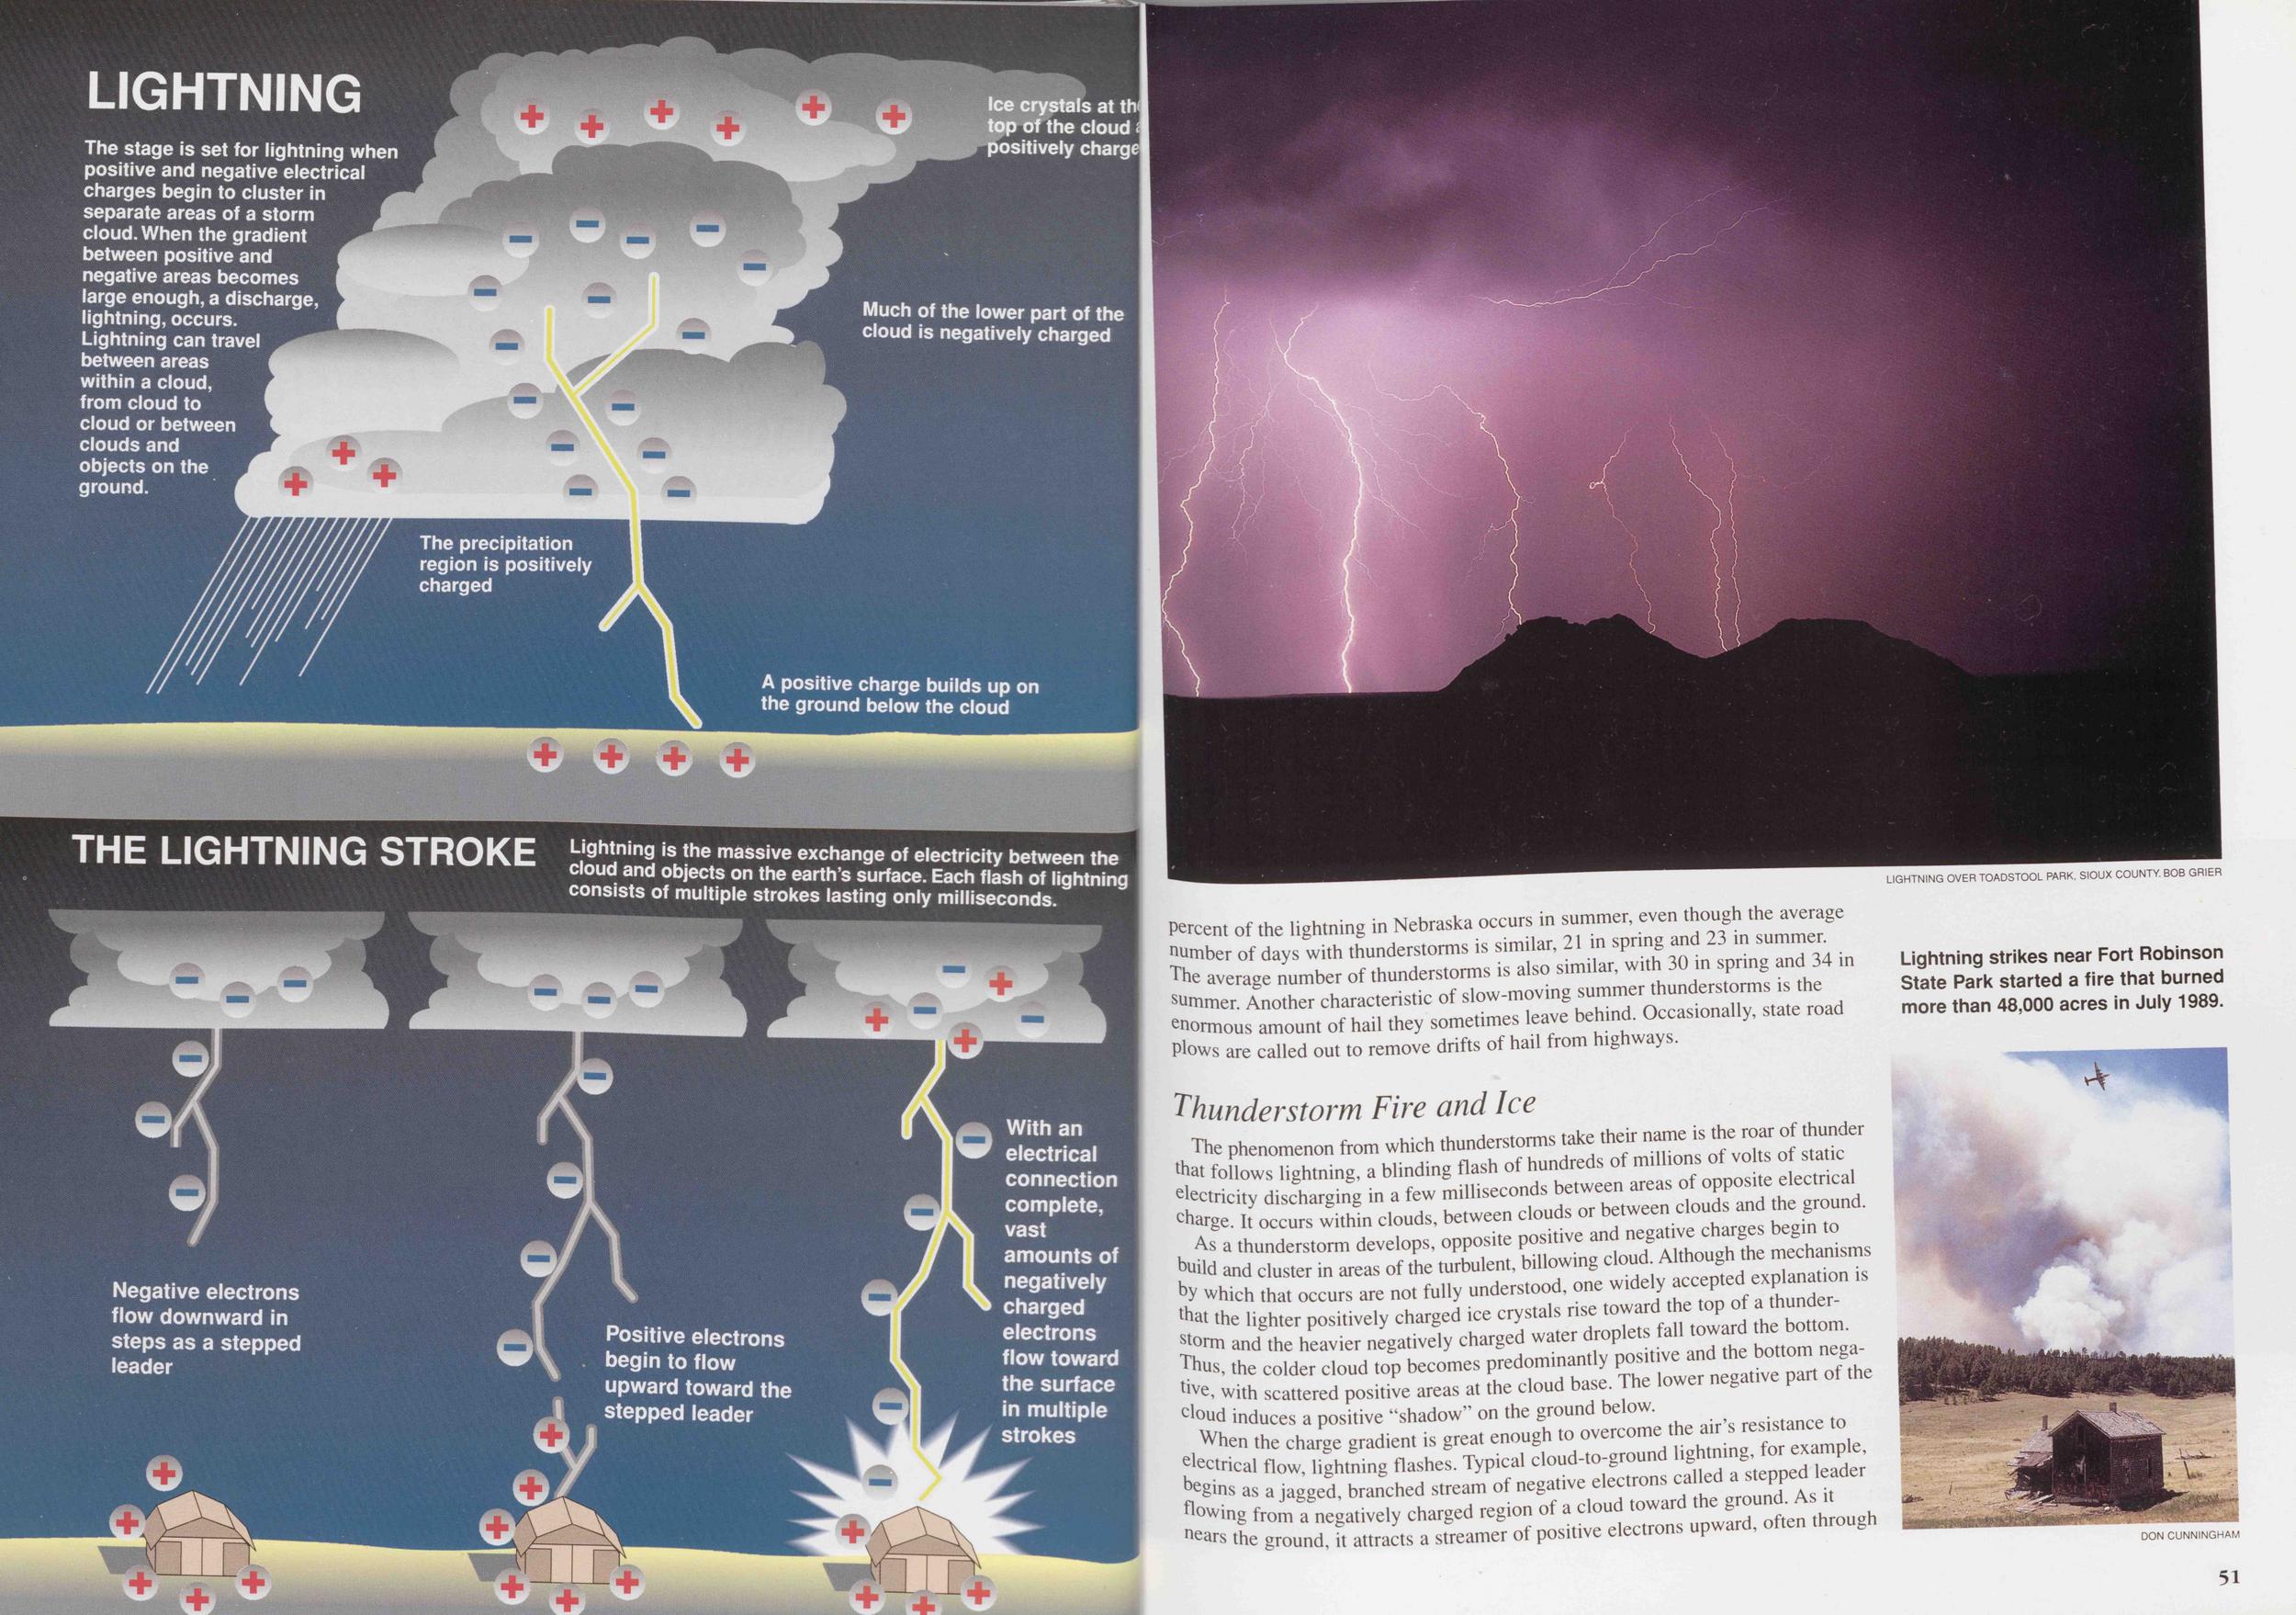
The phenomenon from which thunderstorms take that follows lightning, a blinding flash of hundreds of electricity discharging charge. It occurs within clouds, between clouds
As a thunderstorm develops, opposite positive and charge build and cluster in areas of the turbulent, billowing cloud. by which that occurs are not fully understood, one that the lighter positively charged ice crystals storm and the heavier negatively charged water droplets t Thus, the colder cloud top becomes predominantly , with scattered positive areas at the cloud base. The lower negative pound induces a positive "shadow" on the ground below. resistance to
When the charge gradient is great enough to "v^^™*™*r example electrical flow, lightning flashes. Typical cloud-to-ground begins as a jagged, branched stream of negative electrons called nears the ground, it attracts a streamer of positive electron
 a high feature of the landscape. When leader and streamer meet, a channel for electrical flow is created, and an intense flow of positive electrons travels upward. The return stroke is the visible lightning bolt, a massive flow of negative electrons following the same channel to the ground. Additional strokes often follow, making multiple lightning strikes appear to be a single flickering bolt. The powerful return stroke superheats the surrounding air for a millisecond, causing it to expand. Just as quickly, the air cools and contracts. The resulting shock waves produce the sound of thunder.
Hail, another product of thunderstorms, begins as graupel, ice crystals that grow irregularly as supercooled water droplets freeze onto them, or as frozen raindrops. Held aloft by updrafts, the hailstones grow as supercooled droplets continue to freeze onto them. Hailstones are often tossed about in a cloud, falling then rising again as they encounter strong updrafts.
When hail becomes too heavy to be supported by the storm's updrafts or is swept into a downdraft, it falls. Hail can be as small as a pea or as large as a softball. In rare cases, hailstones weigh a pound or more. To stay aloft long enough to grow to three inches in diameter, hailstones must encounter updrafts traveling about 100 miles per hour.
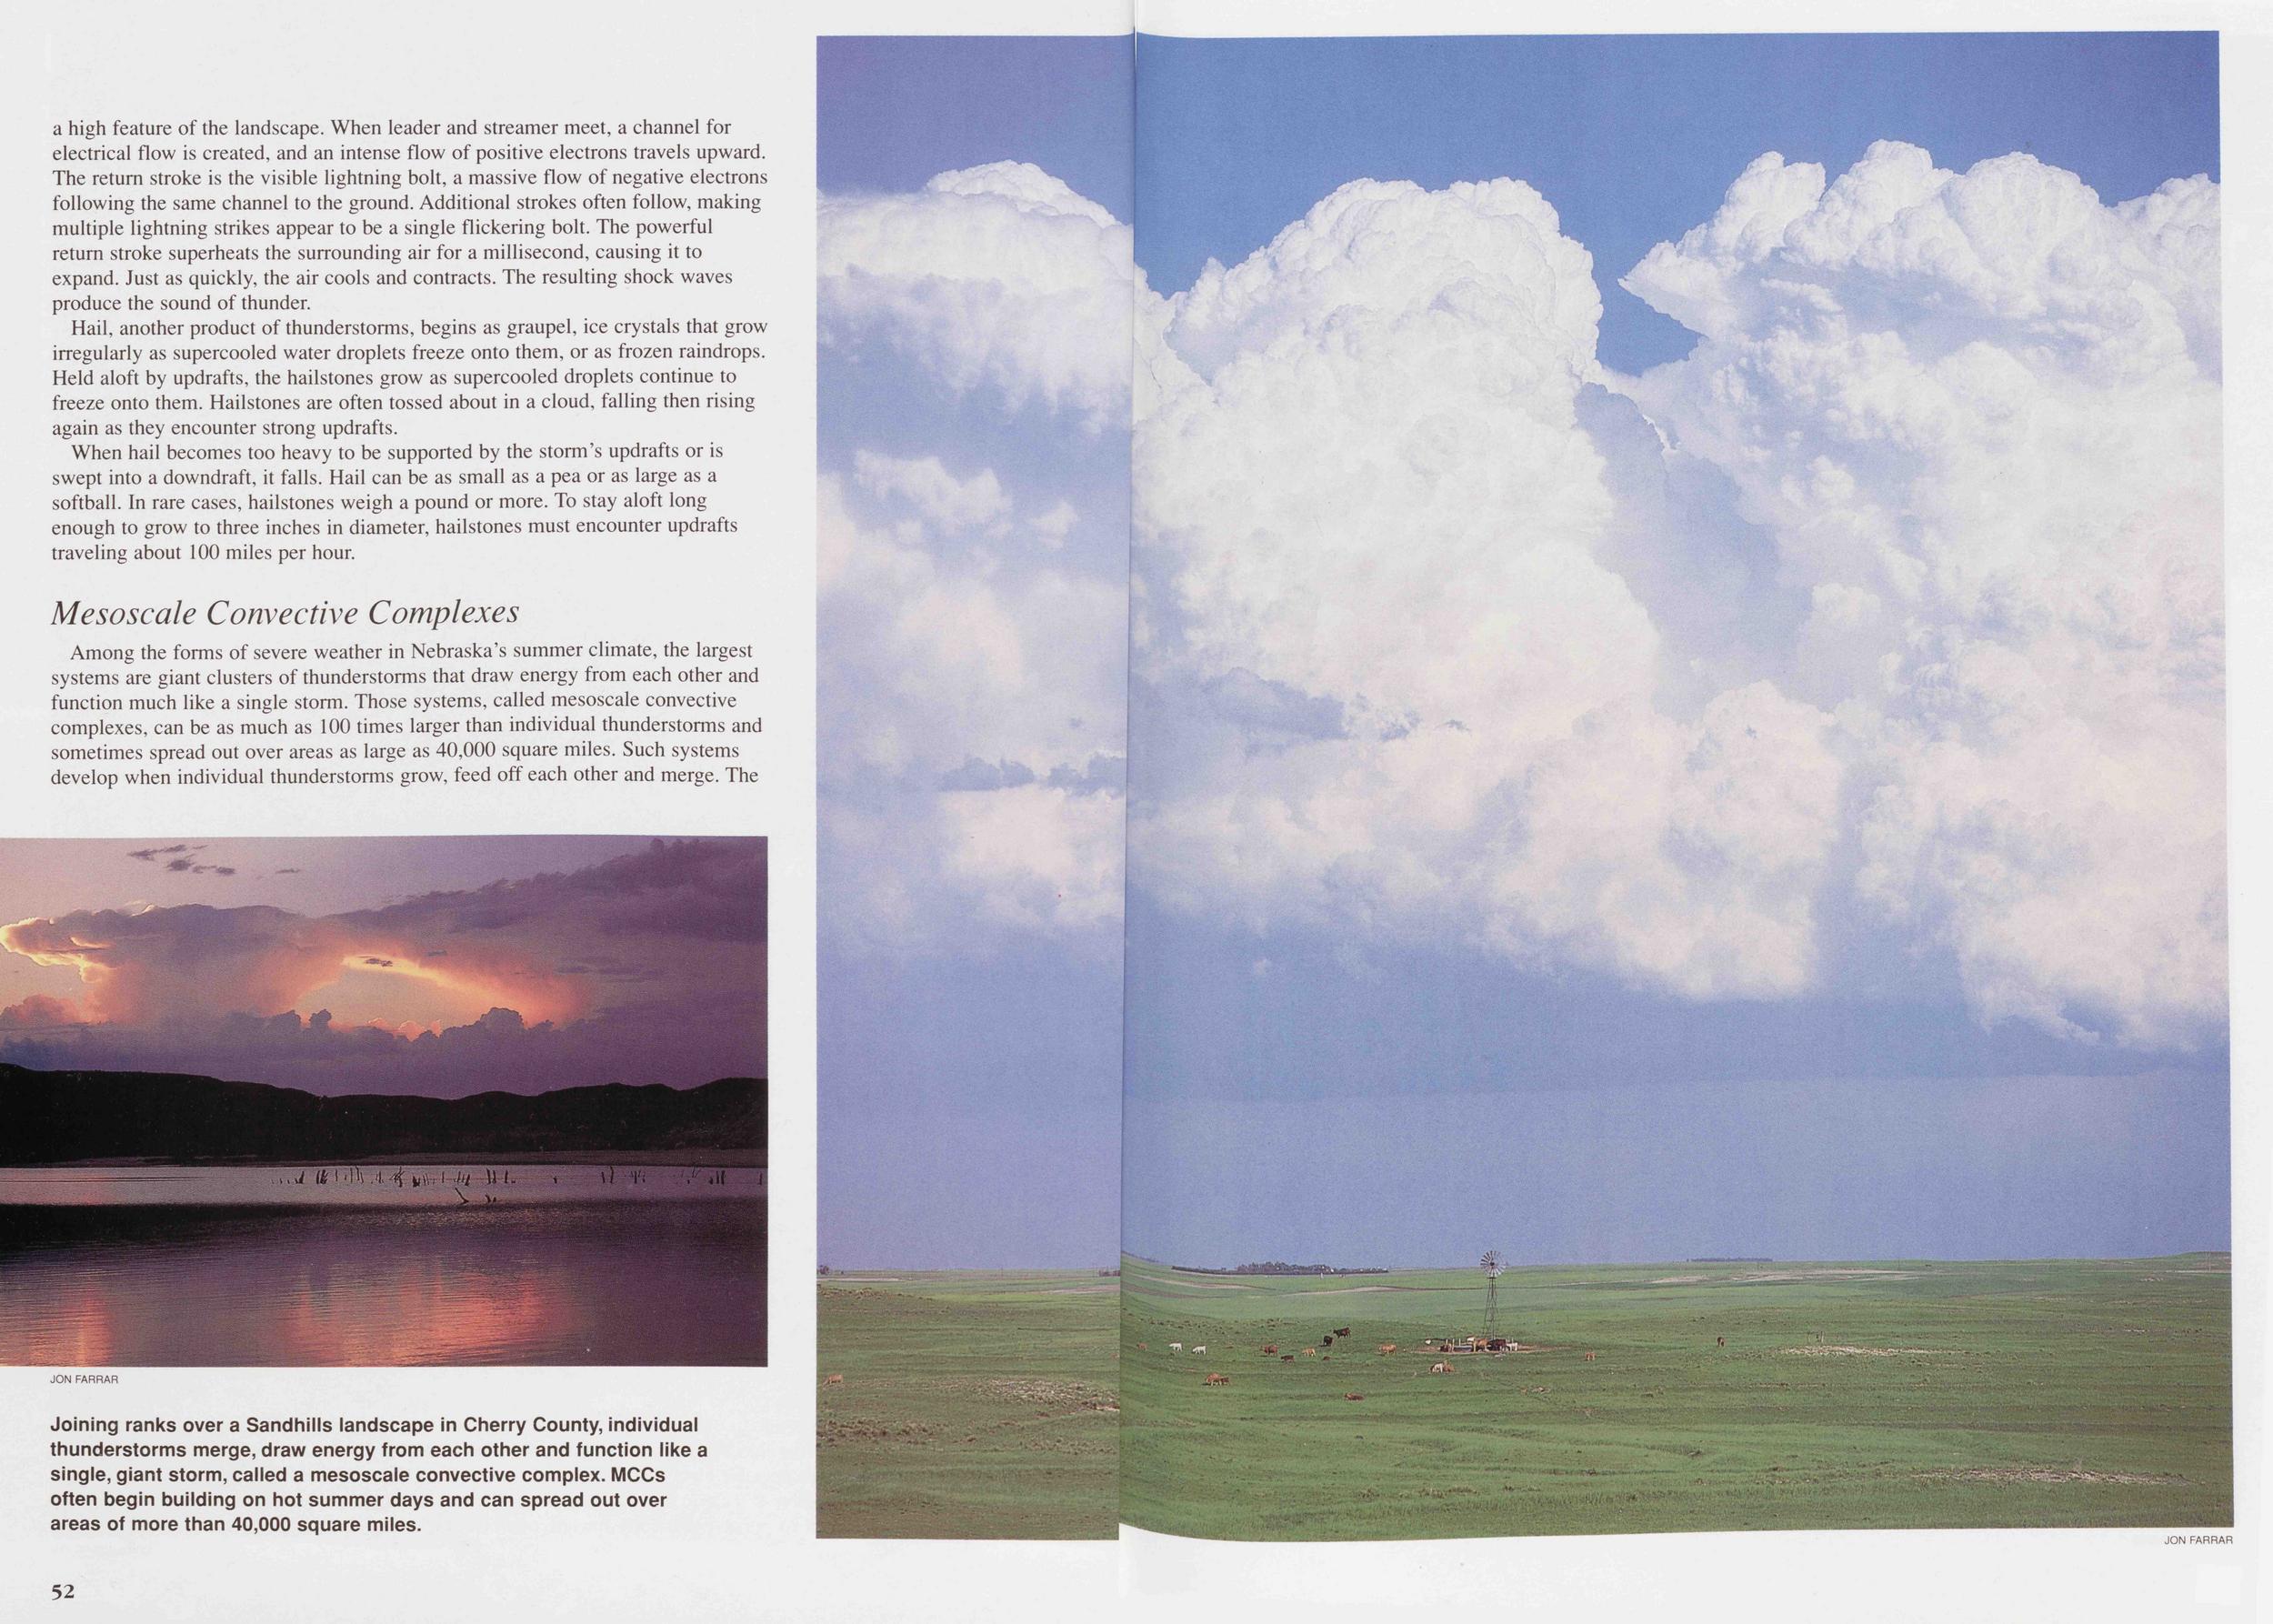
Mesoscale Connective ComplexesAmong the forms of severe weather in Nebraska's summer climate, the largest systems are giant clusters of thunderstorms that draw energy from each other and function much like a single storm. Those systems, called mesoscale convective complexes, can be as much as 100 times larger than individual thunderstorms and sometimes spread out over areas as large as 40,000 square miles. Such systems develop when individual thunderstorms grow, feed off each other and merge. The
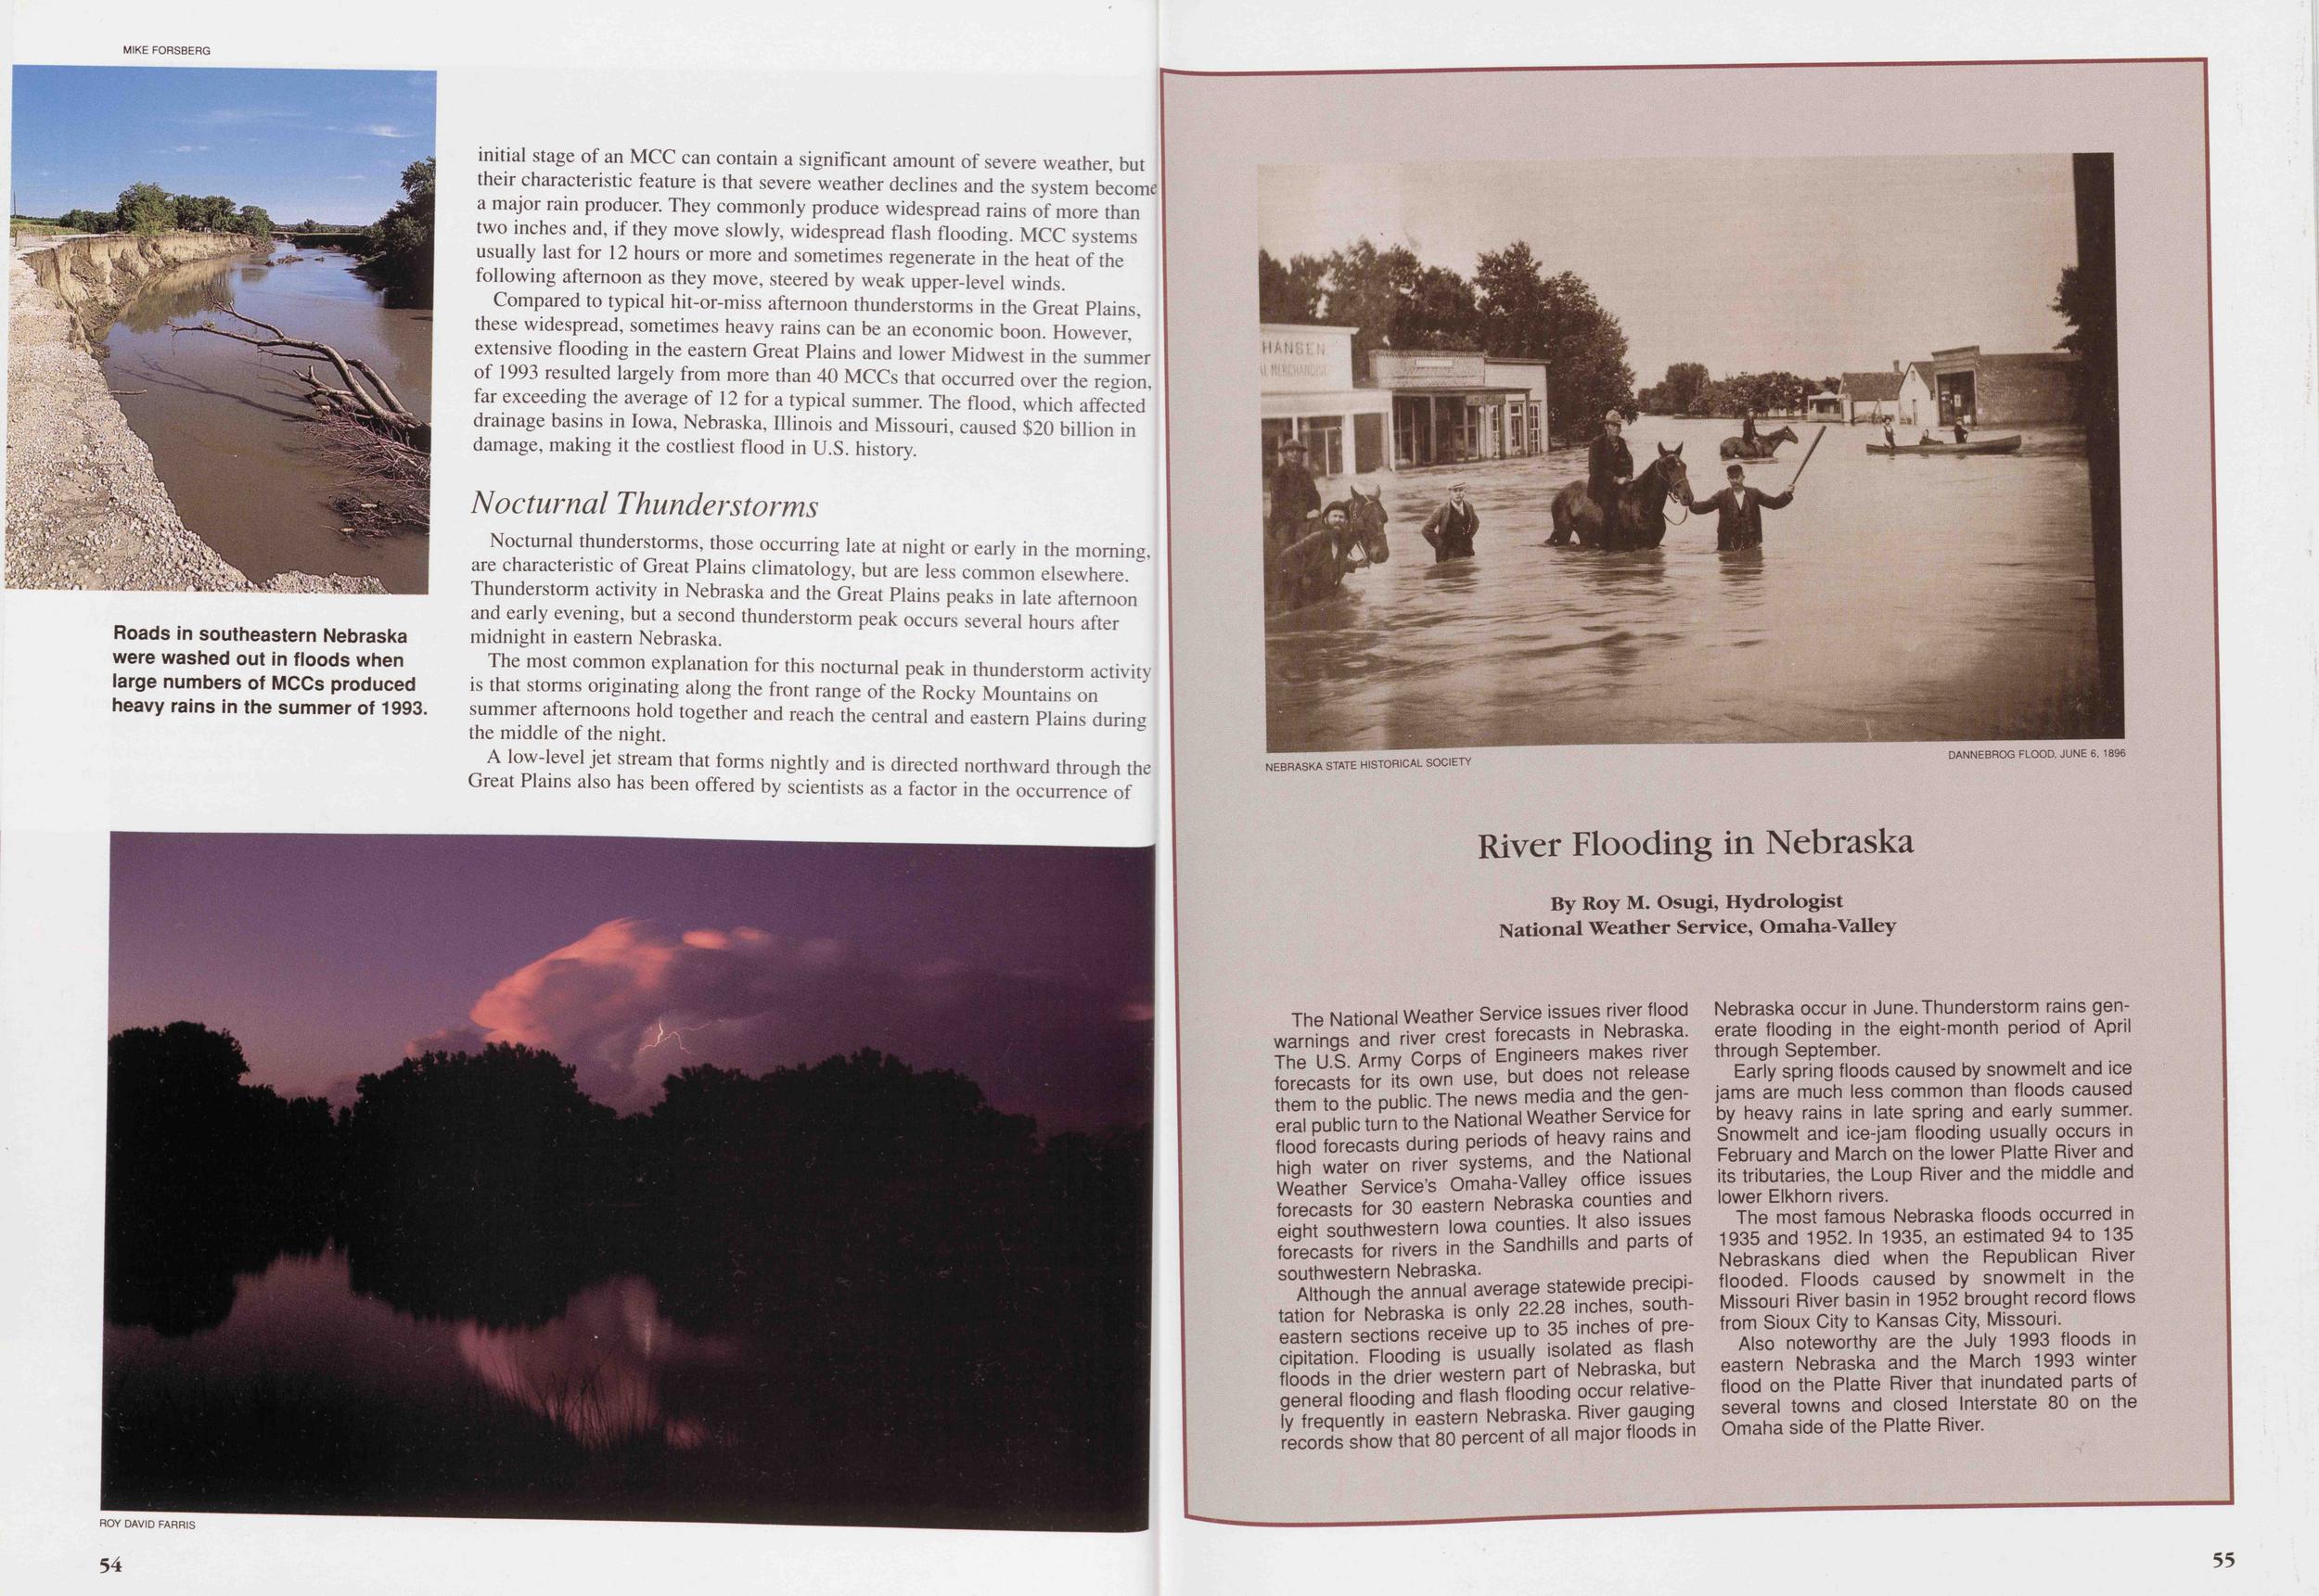
Compared to typical hit-or-miss afternoon thunderstorms in the Great Plains, these widespread, sometimes heavy rains can be an economic boon. However, extensive flooding in the eastern Great Plains and lower Midwest in the summer of 1993 resulted largely from more than 40 MCCs that occurred over the region, far exceeding the average of 12 for a typical summer. The flood, which affected drainage basins in Iowa, Nebraska, Illinois and Missouri, caused $20 billion in damage, making it the costliest flood in U.S. history.
Nocturnal ThunderstormsNocturnal thunderstorms, those occurring late at night or early in the morning, are characteristic of Great Plains climatology, but are less common elsewhere. Thunderstorm activity in Nebraska and the Great Plains peaks in late afternoon and early evening, but a second thunderstorm peak occurs several hours after midnight in eastern Nebraska.
The most common explanation for this nocturnal peak in thunderstorm activity is that storms originating along the front range of the Rocky Mountains on summer afternoons hold together and reach the central and eastern Plains during the middle of the night.
A low-level jet stream that forms nightly and is directed northward through the Great Plains also has been offered by scientists as a factor in the occurrence of nocturnal thunderstorms. The nocturnal low-level jet stream not only provides nioisture from the Gulf of Mexico, but the strong wind speeds provide energy to further "spin up," or develop, these late-night thunderstorms.
The National Weather Service issues river flood warnings and river crest forecasts in Nebraska. The US Army Corps of Engineers makes river forecasts for its own use, but does not release them to the public. The news media and the general public turn to the National Weather Service for flood forecasts during periods of heavy rains and high water on river systems, and the National Weather Service's Omaha-Valley office issues forecasts for 30 eastern Nebraska counties and eight southwestern Iowa counties. It also issues forecasts for rivers in the Sandhills and parts of southwestern Nebraska.
Although the annual average statewide precipitation for Nebraska is only 22.28 inches, southeastern sections receive up to 35 inches of precipitation. Flooding is usually isolated as flash floods in the drier western part of Nebraska but general flooding and flash flooding occur relatively frequently in eastern Nebraska. River gauging records show that 80 percent of all major floods in Nebraska occur in June. Thunderstorm rains generate flooding in the eight-month period of April through September.
Early spring floods caused by snowmelt and ice jams are much less common than floods caused by heavy rains in late spring and early summer. Snowmelt and ice-jam flooding usually occurs in February and March on the lower Platte River and its tributaries, the Loup River and the middle and lower Elkhorn rivers.
The most famous Nebraska floods occurred in 1935 and 1952. In 1935, an estimated 94 to 135 Nebraskans died when the Republican River flooded. Floods caused by snowmelt in the Missouri River basin in 1952 brought record flows from Sioux City to Kansas City, Missouri.
Also noteworthy are the July 1993 floods in eastern Nebraska and the March 1993 winter flood on the Platte River that inundated parts of several towns and closed Interstate 80 on the Omaha side of the Platte River.
55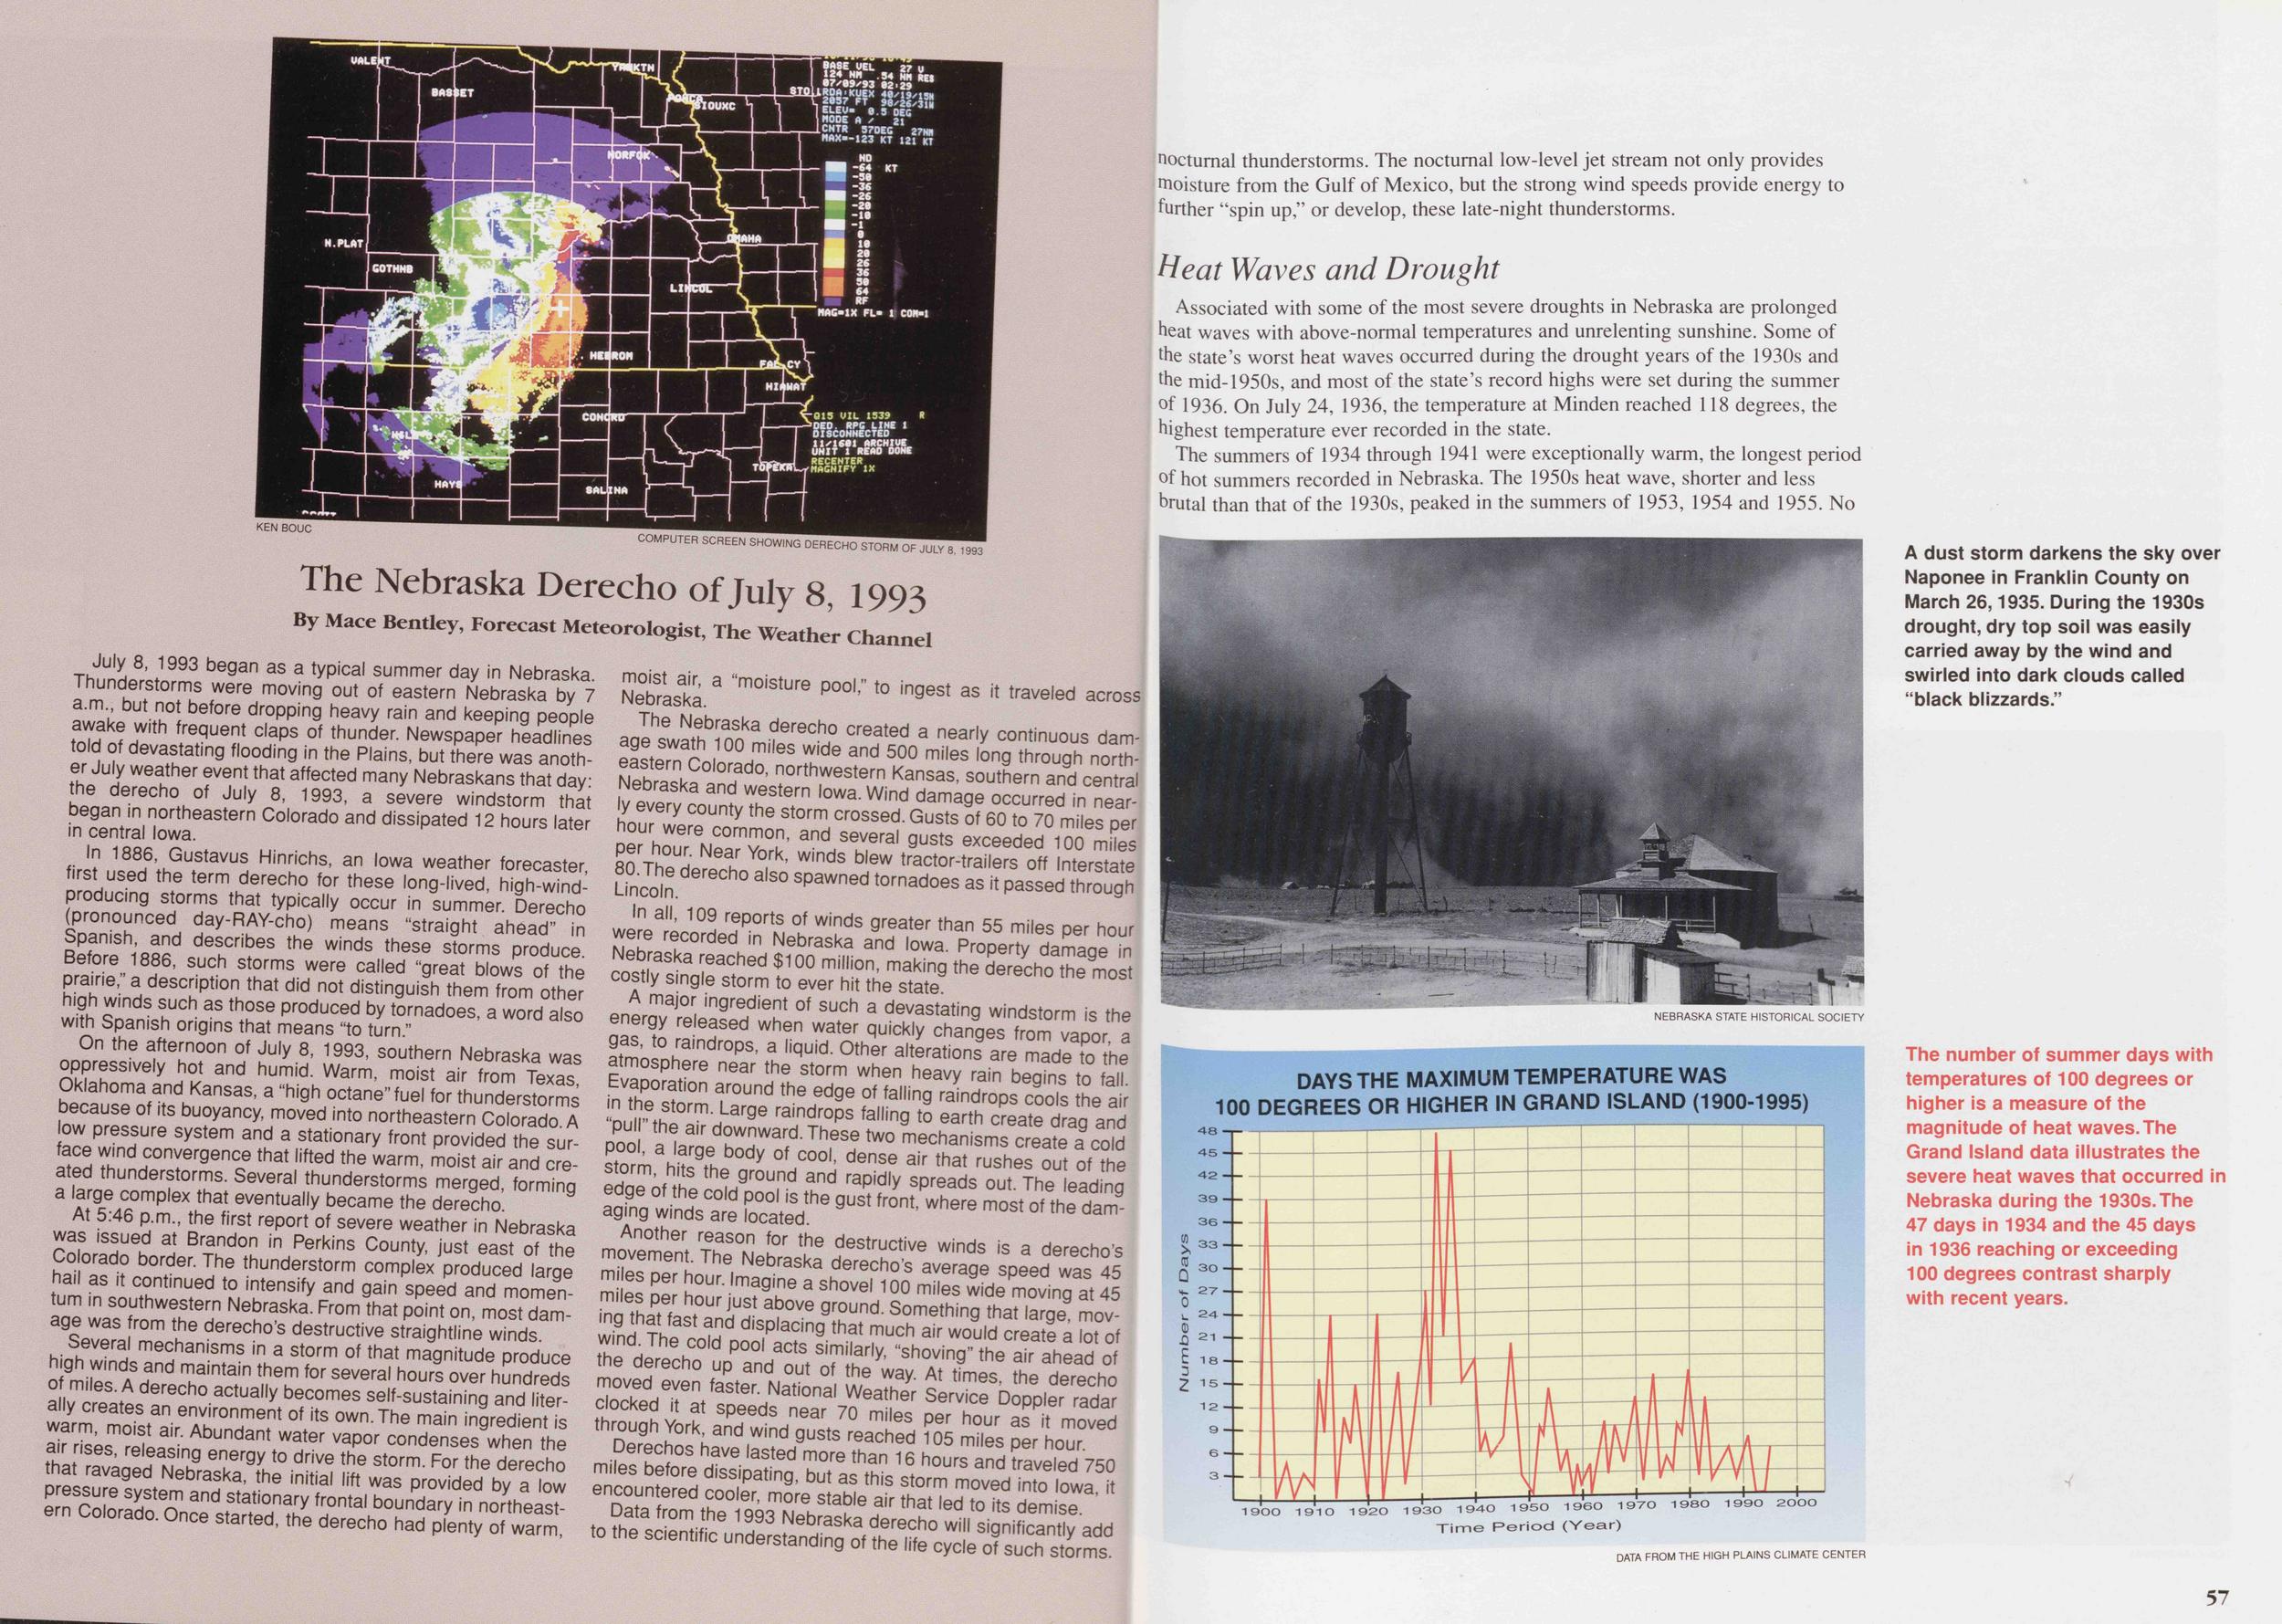
July 8, 1993 began as a typical summer day in Nebraska. Thunderstorms were moving out of eastern Nebraska by 7 a.m., but not before dropping heavy rain and keeping people awake with frequent claps of thunder. Newspaper headlines told of devastating flooding in the Plains, but there was another July weather event that affected many Nebraskans that day: the derecho of July 8, 1993, a severe windstorm that began in northeastern Colorado and dissipated 12 hours later in central Iowa.
In 1886, Gustavus Hinrichs, an Iowa weather forecaster, first used the term derecho for these long-lived, high-wind producing storms that typically occur in summer. Derecho (pronounced day-RAY-cho) means "straight ahead" in Spanish, and describes the winds these storms produce. Before 1886, such storms were called "great blows of the prairie," a description that did not distinguish them from other high winds such as those produced by tornadoes, a word also with Spanish origins that means "to turn."
On the afternoon of July 8, 1993, southern Nebraska was oppressively hot and humid. Warm, moist air from Texas, Oklahoma and Kansas, a "high octane" fuel for thunderstorms because of its buoyancy, moved into northeastern Colorado. A low pressure system and a stationary front provided the surface wind convergence that lifted the warm, moist air and created thunderstorms. Several thunderstorms merged, forming a large complex that eventually became the derecho.
At 5:46 p.m., the first report of severe weather in Nebraska was issued at Brandon in Perkins County, just east of the Colorado border. The thunderstorm complex produced large hail as it continued to intensify and gain speed and momentum in southwestern Nebraska. From that point on, most damage was from the derecho's destructive straight line winds.
Several mechanisms in a storm of that magnitude produce high winds and maintain them for several hours over hundreds of miles. A derecho actually becomes self-sustaining and literally creates an environment of its own. The main ingredient is warm, moist air. Abundant water vapor condenses when the air rises, releasing energy to drive the storm. For the derecho that ravaged Nebraska, the initial lift was provided by a low pressure system and stationary frontal boundary in northeastern Colorado. Once started, the derecho had plenty of warm, moist air, a "moisture pool," to ingest as it traveled across Nebraska.
The Nebraska derecho created a nearly continuous damage swath 100 miles wide and 500 miles long through northeastern Colorado, northwestern Kansas, southern and central Nebraska and western Iowa. Wind damage occurred in nearly every county the storm crossed. Gusts of 60 to 70 miles per hour were common, and several gusts exceeded 100 miles per hour. Near York, winds blew tractor-trailers off Interstate 80. The derecho also spawned tornadoes as it passed through Lincoln.
In all, 109 reports of winds greater than 55 miles per hour were recorded in Nebraska and Iowa. Property damage in Nebraska reached $100 million, making the derecho the most costly single storm to ever hit the state.
A major ingredient of such a devastating windstorm is the energy released when water quickly changes from vapor, a gas, to raindrops, a liquid. Other alterations are made to the atmosphere near the storm when heavy rain begins to fall. Evaporation around the edge of falling raindrops cools the air in the storm. Large raindrops falling to earth create drag and "pull" the air downward. These two mechanisms create a cold pool, a large body of cool, dense air that rushes out of the storm, hits the ground and rapidly spreads out. The leading edge of the cold pool is the gust front, where most of the damaging winds are located.
Another reason for the destructive winds is a derecho's movement. The Nebraska derecho's average speed was 45 miles per hour. Imagine a shovel 100 miles wide moving at 45 miles per hour just above ground. Something that large, moving that fast and displacing that much air would create a lot of wind. The cold pool acts similarly, "shoving" the air ahead of the derecho up and out of the way. At times, the derecho moved even faster. National Weather Service Doppler radar clocked it at speeds near 70 miles per hour as it moved through York, and wind gusts reached 105 miles per hour.
Derechos have lasted more than 16 hours and traveled 750 miles before dissipating, but as this storm moved into Iowa, it encountered cooler, more stable air that led to its demise.
Data from the 1993 Nebraska derecho will significantly add to the scientific understanding of the life cycle of such storms.
Heat Waves and DroughtAssociated with some of the most severe droughts in Nebraska are prolonged heat waves with above-normal temperatures and unrelenting sunshine. Some of the state's worst heat waves occurred during the drought years of the 1930s and the mid-1950s, and most of the state's record highs were set during the summer °f 1936. On July 24, 1936, the temperature at Minden reached 118 degrees, the highest temperature ever recorded in the state.
The summers of 1934 through 1941 were exceptionally warm, the longest period °f hot summers recorded in Nebraska. The 1950s heat wave, shorter and less hrutal than that of the 1930s, peaked in the summers of 1953, 1954 and 1955. No
"Drought" is a relative term, making it difficult to formulate a definition more precise than "abnormal dryness for a particular region." In general, though, a drought is a long-lasting moisture deficit that leads to abnormally dry soils and significantly reduced groundwater and stream flows. Droughts affect more people throughout the world than any other climatic event.
Because normal precipitation varies from one region to another, drought is difficult to define in terms of inches of precipitation. The annual precipitation that would be considered a drought in Florida would constitute a wet year in Arizona. Thus, the perception and definition of a drought varies with the climate type.
Droughts can occur in every climatic region, but some regions are more susceptible than others. Overall, the world vulnerability to drought has increased steadily over the centuries, primarily because of an ever-expanding population that puts heavy demands on water and other natural resources. Drought can occur at any time of the year, but when it occurs in summer, its impact on the agricultural economy is most severe.
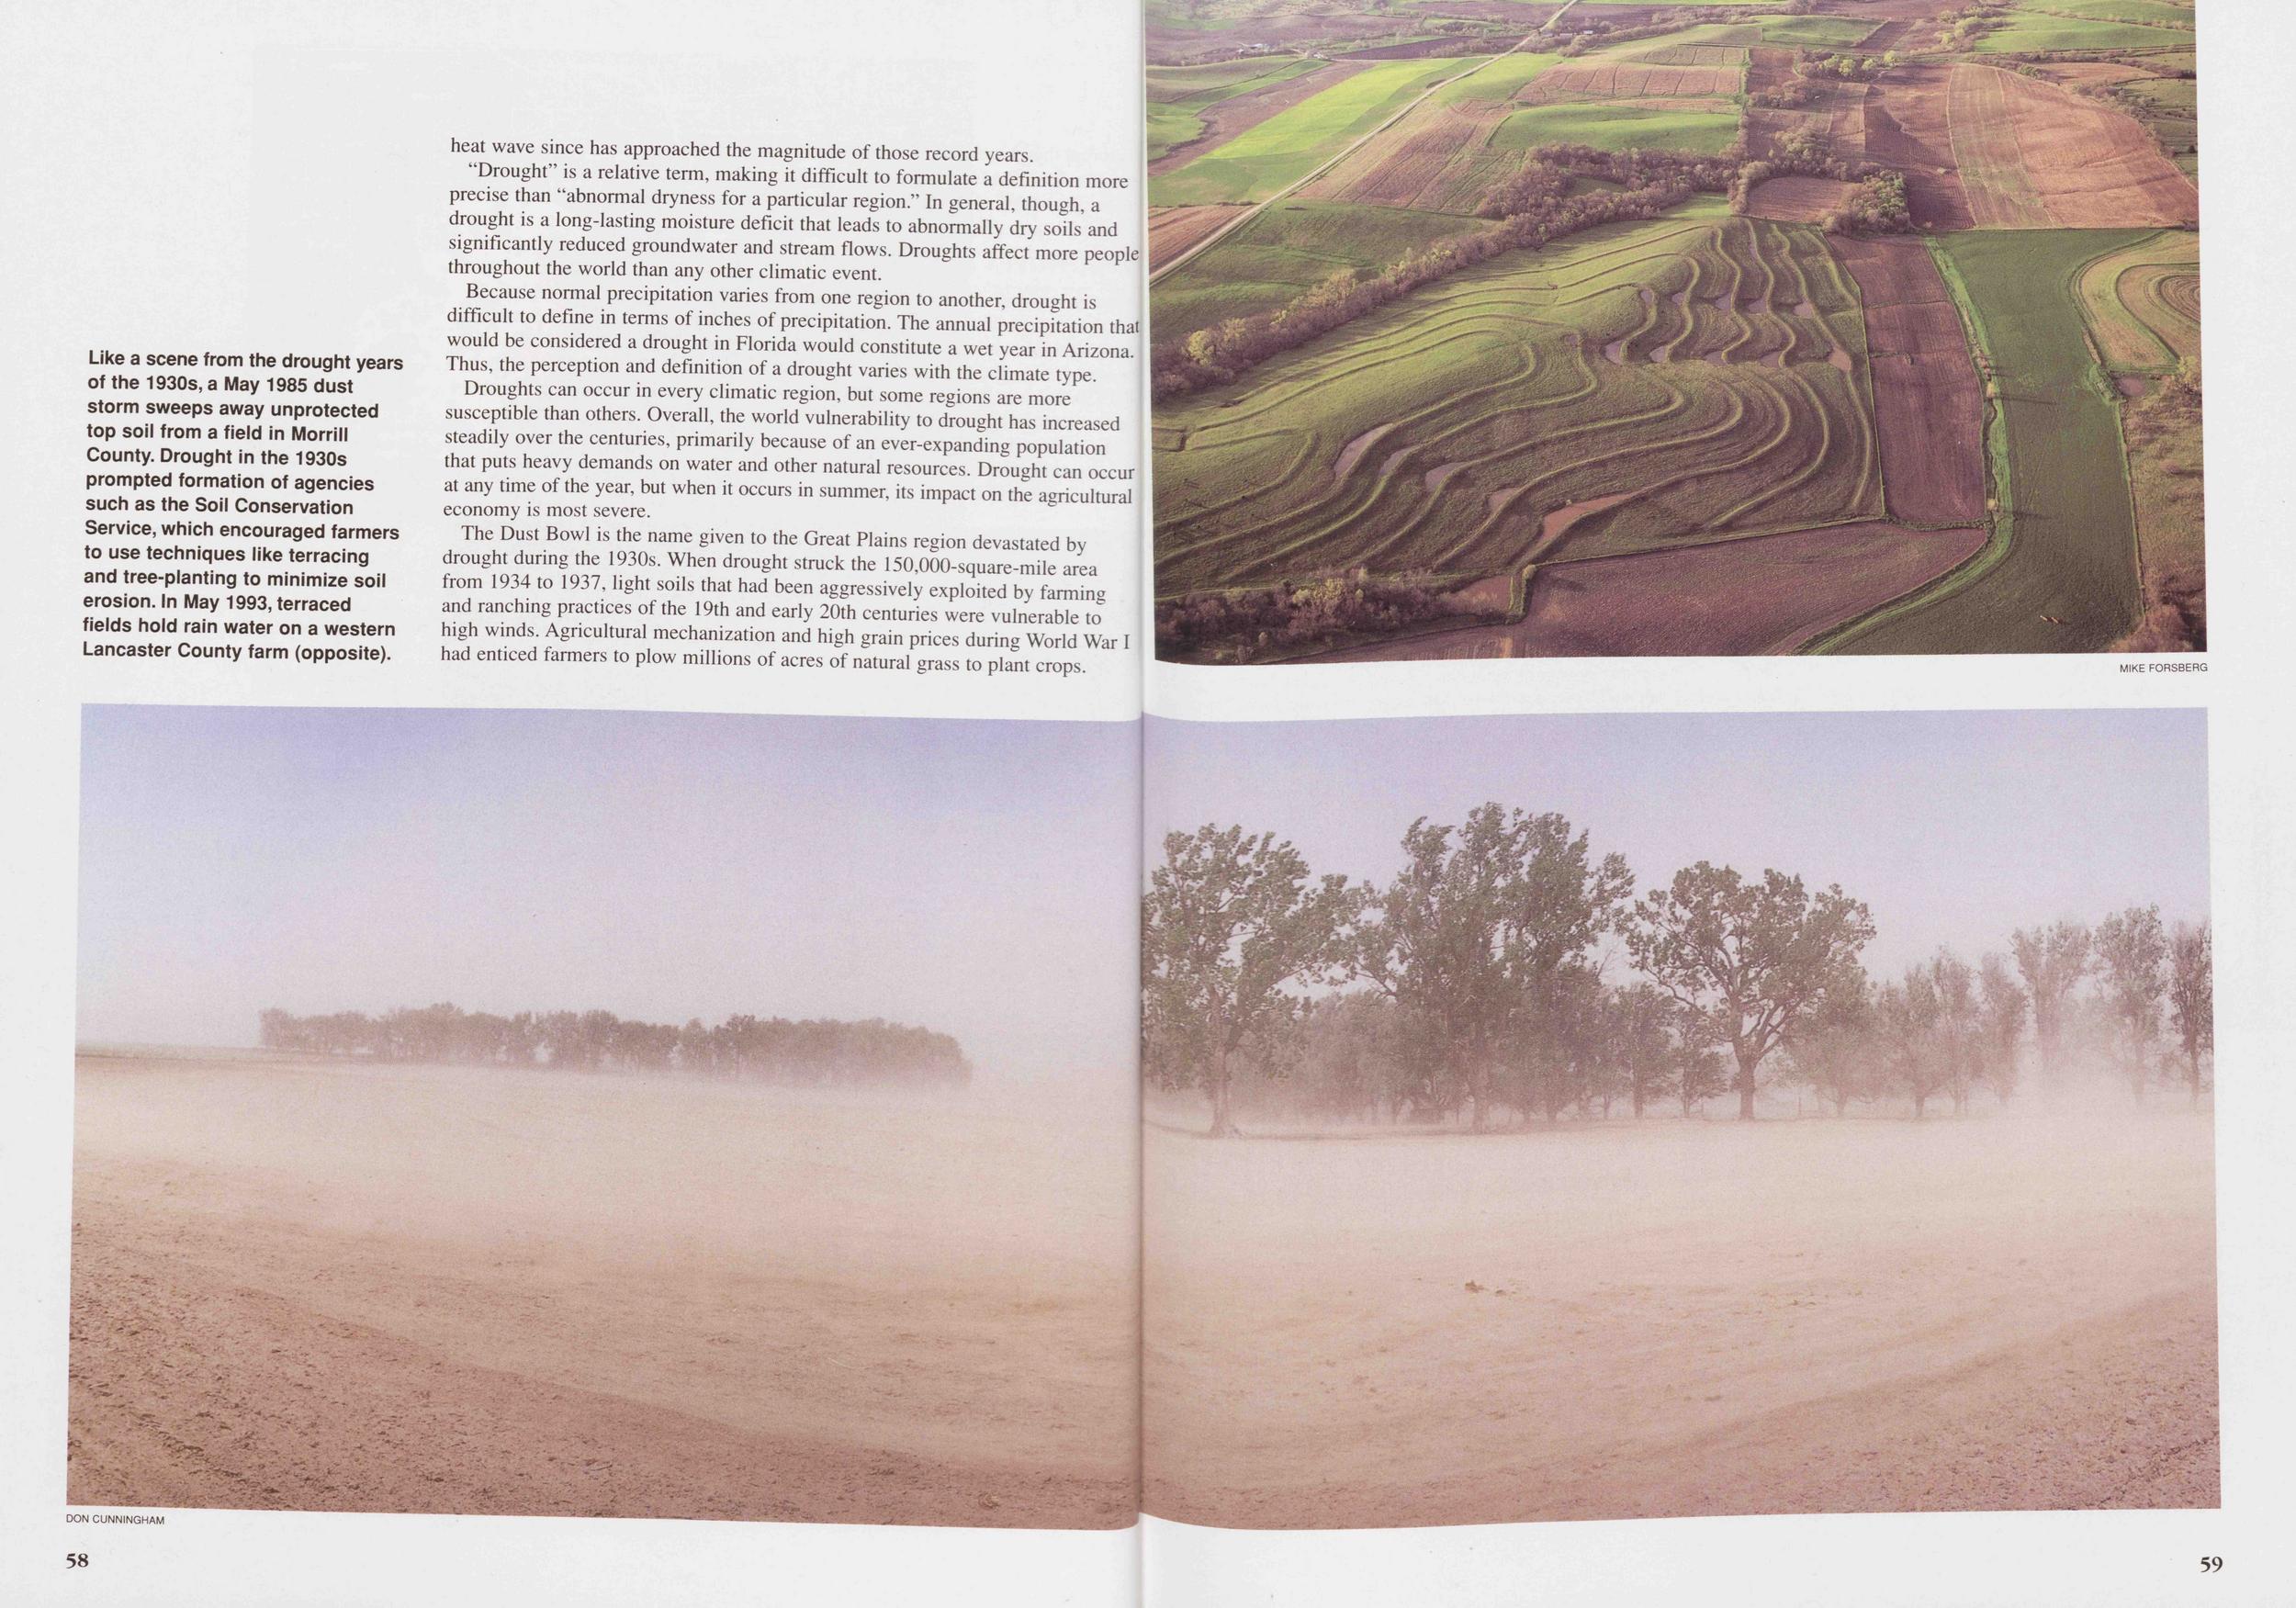
The Dust Bowl is the name given to the Great Plains region devastated by drought during the 1930s. When drought struck the 150,000-square-mile area from 1934 to 1937, light soils that had been aggressively exploited by farming and ranching practices of the 19th and early 20th centuries were vulnerable to high winds. Agricultural mechanization and high grain prices during World War I had enticed farmers to plow millions of acres of natural grass to plant crops. Lacking the strong root system of grass to anchor it, the soil was easily picked up by the wind and swirled into dense clouds, called "black blizzards." Recurrent dust storms destroyed crops and pastures, driving 60 percent of the population from the region.
58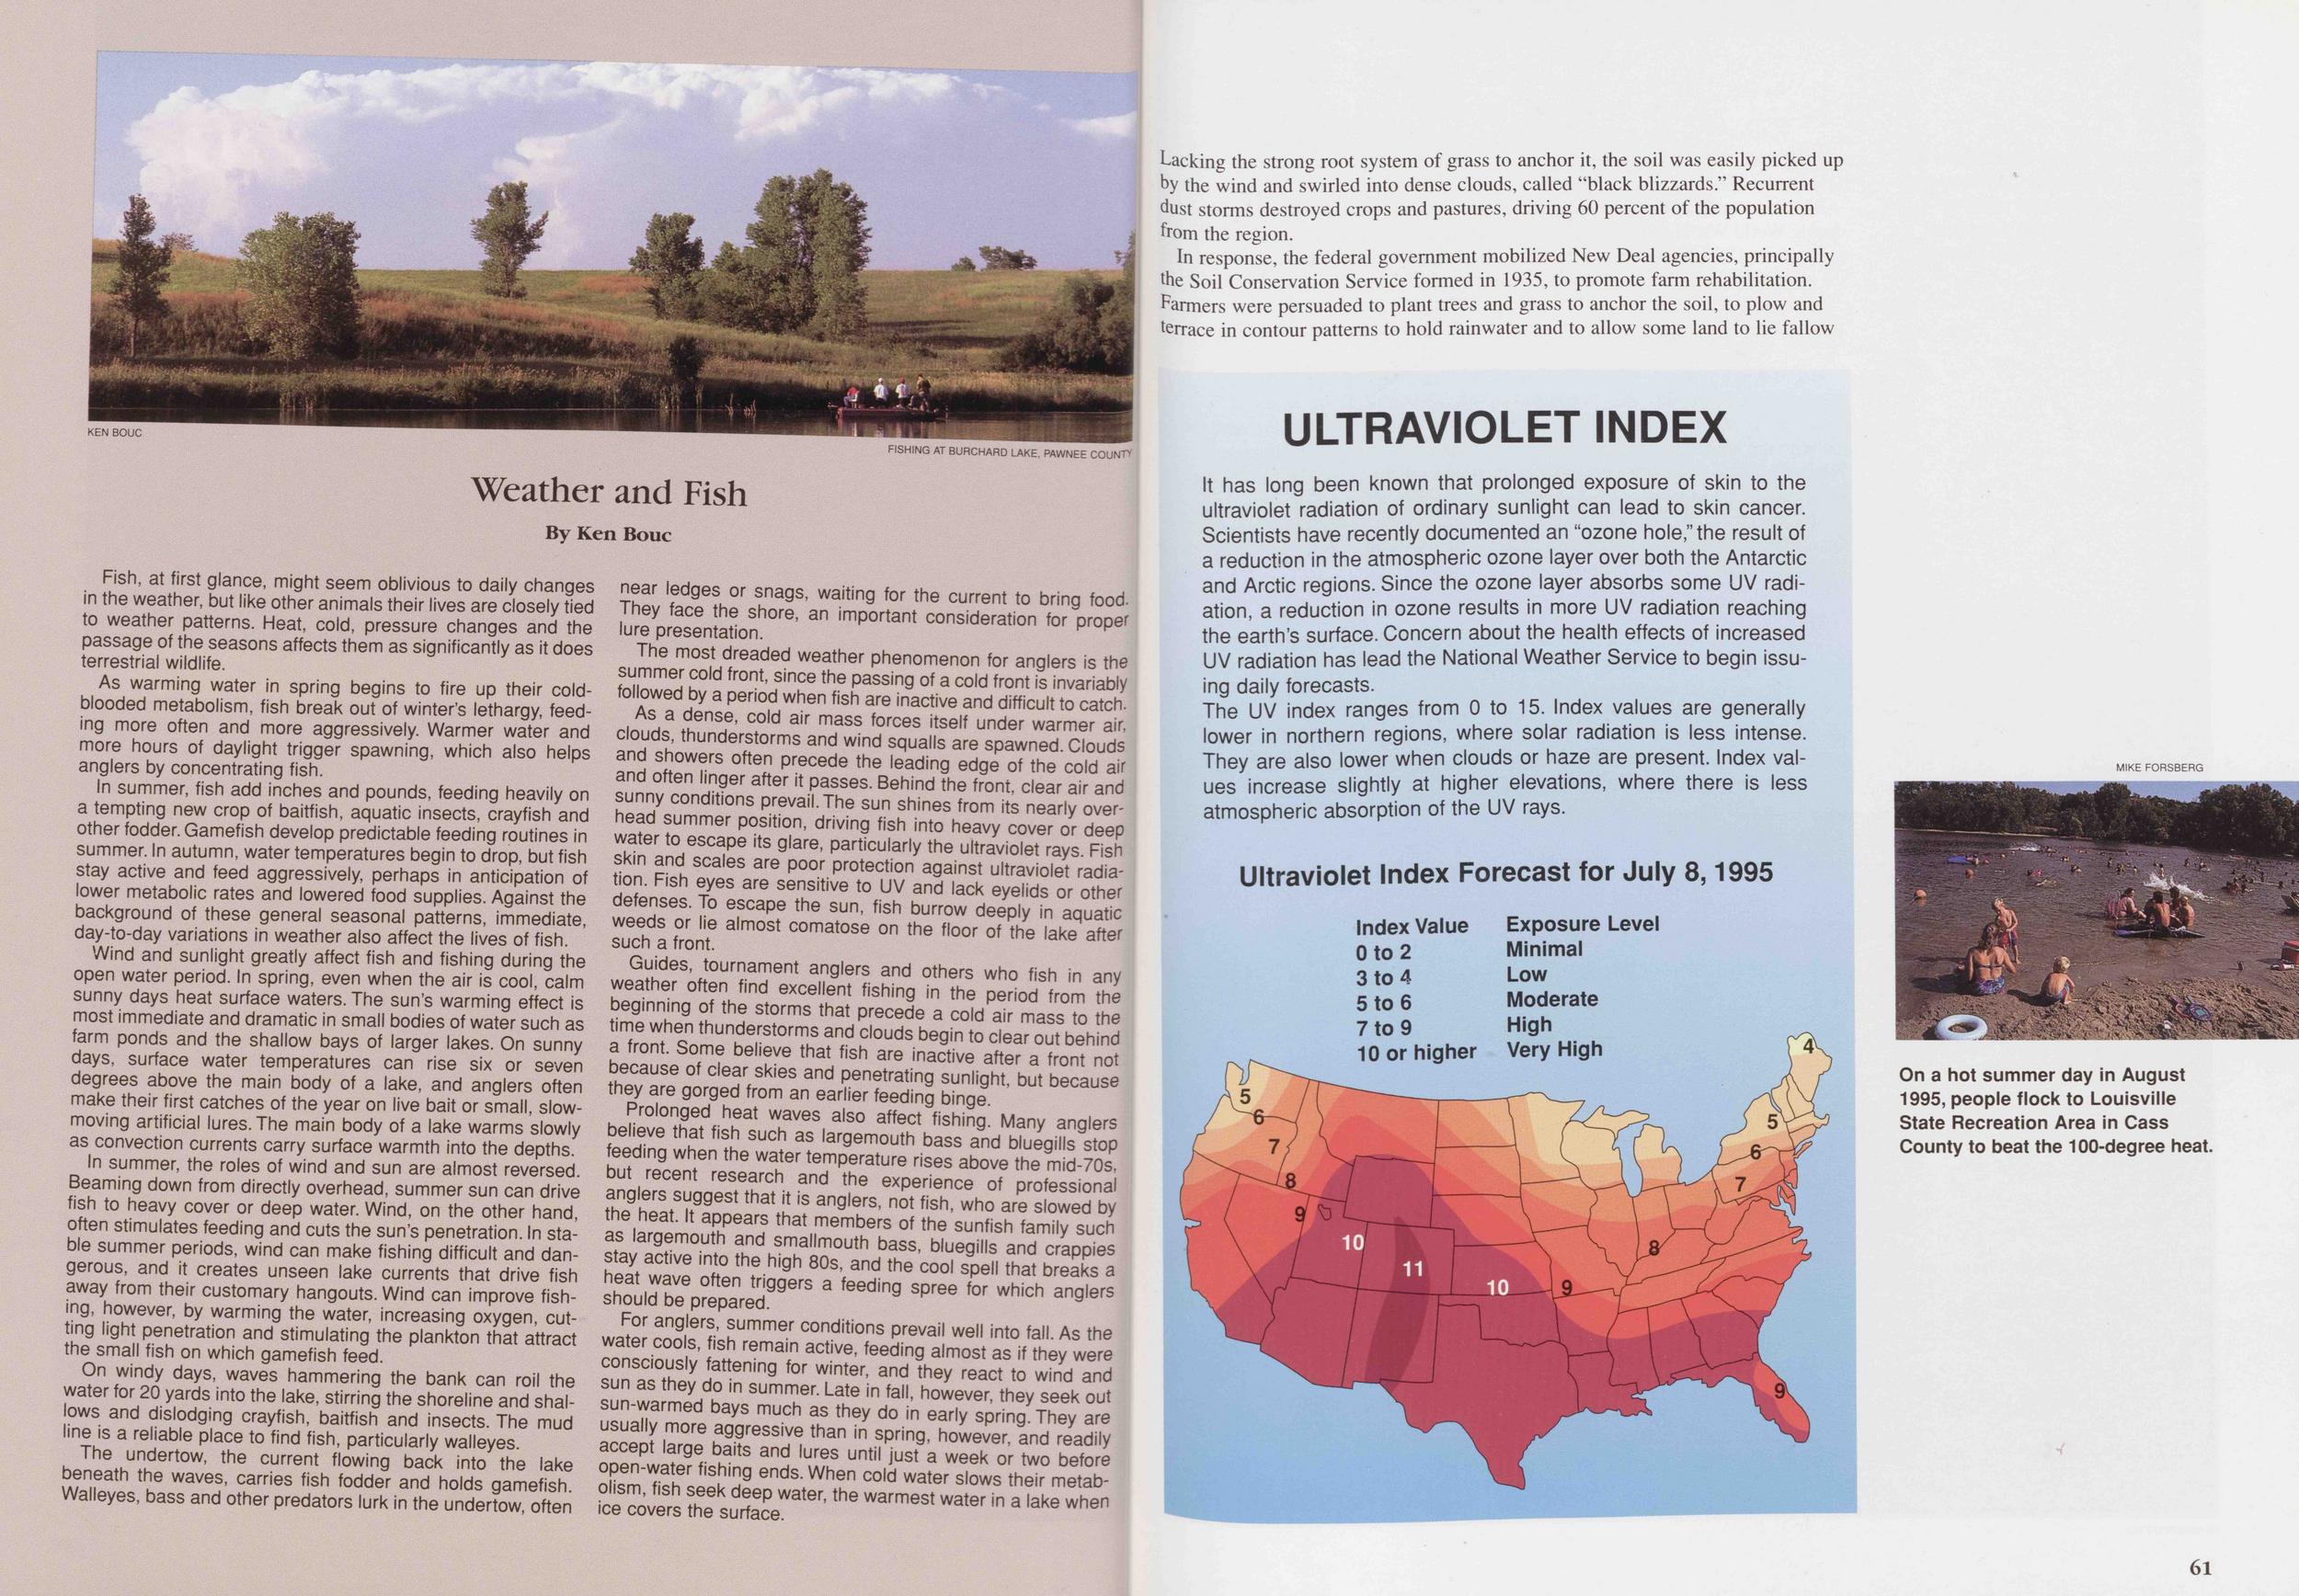
Fish, at first glance, might seem oblivious to daily changes in the weather, but like other animals their lives are closely tied to weather patterns. Heat, cold, pressure changes and the passage of the seasons affects them as significantly as it does terrestrial wildlife.
As warming water in spring begins to fire up their cold blooded metabolism, fish break out of winter's lethargy, feeding more often and more aggressively. Warmer water and more hours of daylight trigger spawning, which also helps anglers by concentrating fish.
In summer, fish add inches and pounds, feeding heavily on a tempting new crop of baitfish, aquatic insects, crayfish and other fodder. Gamefish develop predictable feeding routines in summer. In autumn, water temperatures begin to drop, but fish stay active and feed aggressively, perhaps in anticipation of lower metabolic rates and lowered food supplies. Against the background of these general seasonal patterns, immediate, day-to-day variations in weather also affect the lives of fish.
Wind and sunlight greatly affect fish and fishing during the open water period. In spring, even when the air is cool, calm sunny days heat surface waters. The sun's warming effect is most immediate and dramatic in small bodies of water such as farm ponds and the shallow bays of larger lakes. On sunny days, surface water temperatures can rise six or seven degrees above the main body of a lake, and anglers often make their first catches of the year on live bait or small, slow-moving artificial lures. The main body of a lake warms slowly as convection currents carry surface warmth into the depths.
In summer, the roles of wind and sun are almost reversed. Beaming down from directly overhead, summer sun can drive fish to heavy cover or deep water. Wind, on the other hand, often stimulates feeding and cuts the sun's penetration. In stable summer periods, wind can make fishing difficult and dangerous, and it creates unseen lake currents that drive fish away from their customary hangouts. Wind can improve fishing, however, by warming the water, increasing oxygen, cut- ting light penetration and stimulating the plankton that attract the small fish on which gamefish feed.
On windy days, waves hammering the bank can roil the water for 20 yards into the lake, stirring the shoreline and shal- lows and dislodging crayfish, baitfish and insects. The mud line is a reliable place to find fish, particularly walleyes.
The undertow, the current flowing back into the lake beneath the waves, carries fish fodder and holds gamefish. Walleyes, bass and other predators lurk in the undertow, often near ledges or snags, waiting for the current to bring food- They face the shore, an important consideration for proper lure presentation.
The most dreaded weather phenomenon for anglers is the summer cold front, since the passing of a cold front is invariably followed by a period when fish are inactive and difficult to catch.
As a dense, cold air mass forces itself under warmer air, clouds, thunderstorms and wind squalls are spawned. Clouds and showers often precede the leading edge of the cold air and often linger after it passes. Behind the front, clear air and sunny conditions prevail. The sun shines from its nearly overhead summer position, driving fish into heavy cover or deep water to escape its glare, particularly the ultraviolet rays. Fish skin and scales are poor protection against ultraviolet radiation. Fish eyes are sensitive to UV and lack eyelids or other defenses. To escape the sun, fish burrow deeply in aquatic weeds or lie almost comatose on the floor of the lake after such a front.
Guides, tournament anglers and others who fish in any weather often find excellent fishing in the period from the beginning of the storms that precede a cold air mass to the time when thunderstorms and clouds begin to clear out behind a front. Some believe that fish are inactive after a front not because of clear skies and penetrating sunlight, but because they are gorged from an earlier feeding binge.
Prolonged heat waves also affect fishing. Many anglers believe that fish such as largemouth bass and bluegills stop feeding when the water temperature rises above the mid-70s, but recent research and the experience of professional anglers suggest that it is anglers, not fish, who are slowed by the heat. It appears that members of the sunfish family such as largemouth and smallmouth bass, bluegills and crappies stay active into the high 80s, and the cool spell that breaks a heat wave often triggers a feeding spree for which anglers should be prepared.
For anglers, summer conditions prevail well into fall. As the water cools, fish remain active, feeding almost as if they were consciously fattening for winter, and they react to wind and sun as they do in summer. Late in fall, however, they seek out sun-warmed bays much as they do in early spring. They are usually more aggressive than in spring, however, and readily accept large baits and lures until just a week or two before open-water fishing ends. When cold water slows their metabolism, fish seek deep water, the warmest water in a lake when ice covers the surface.
In response, the federal government mobilized New Deal agencies, principally the Soil Conservation Service formed in 1935, to promote farm rehabilitation. Farmers were persuaded to plant trees and grass to anchor the soil, to plow and terrace in contour patterns to hold rainwater and to allow some land to lie fallow each year so soil could regenerate. The government also purchased 11.3 million acres of land to keep it out of production.
ULTRAVIOLET INDEXIt has long been known that prolonged exposure of skin to the ultraviolet radiation of ordinary sunlight can lead to skin cancer. Scientists have recently documented an "ozone hole," the result of a reduction in the atmospheric ozone layer over both the Antarctic and Arctic regions. Since the ozone layer absorbs some UV radiation, a reduction in ozone results in more UV radiation reaching the earth's surface. Concern about the health effects of increased UV radiation has lead the National Weather Service to begin issuing daily forecasts.
The UV index ranges from 0 to 15. Index values are generally lower in northern regions, where solar radiation is less intense. They are also lower when clouds or haze are present. Index values increase slightly at higher elevations, where there is less atmospheric absorption of the UV rays.
Ultraviolet Index Forecast for July 851995 Index Value Exposure Level 0to2 Minimal 3 to 4 Low 5 to 6 Moderate 7 to 9 High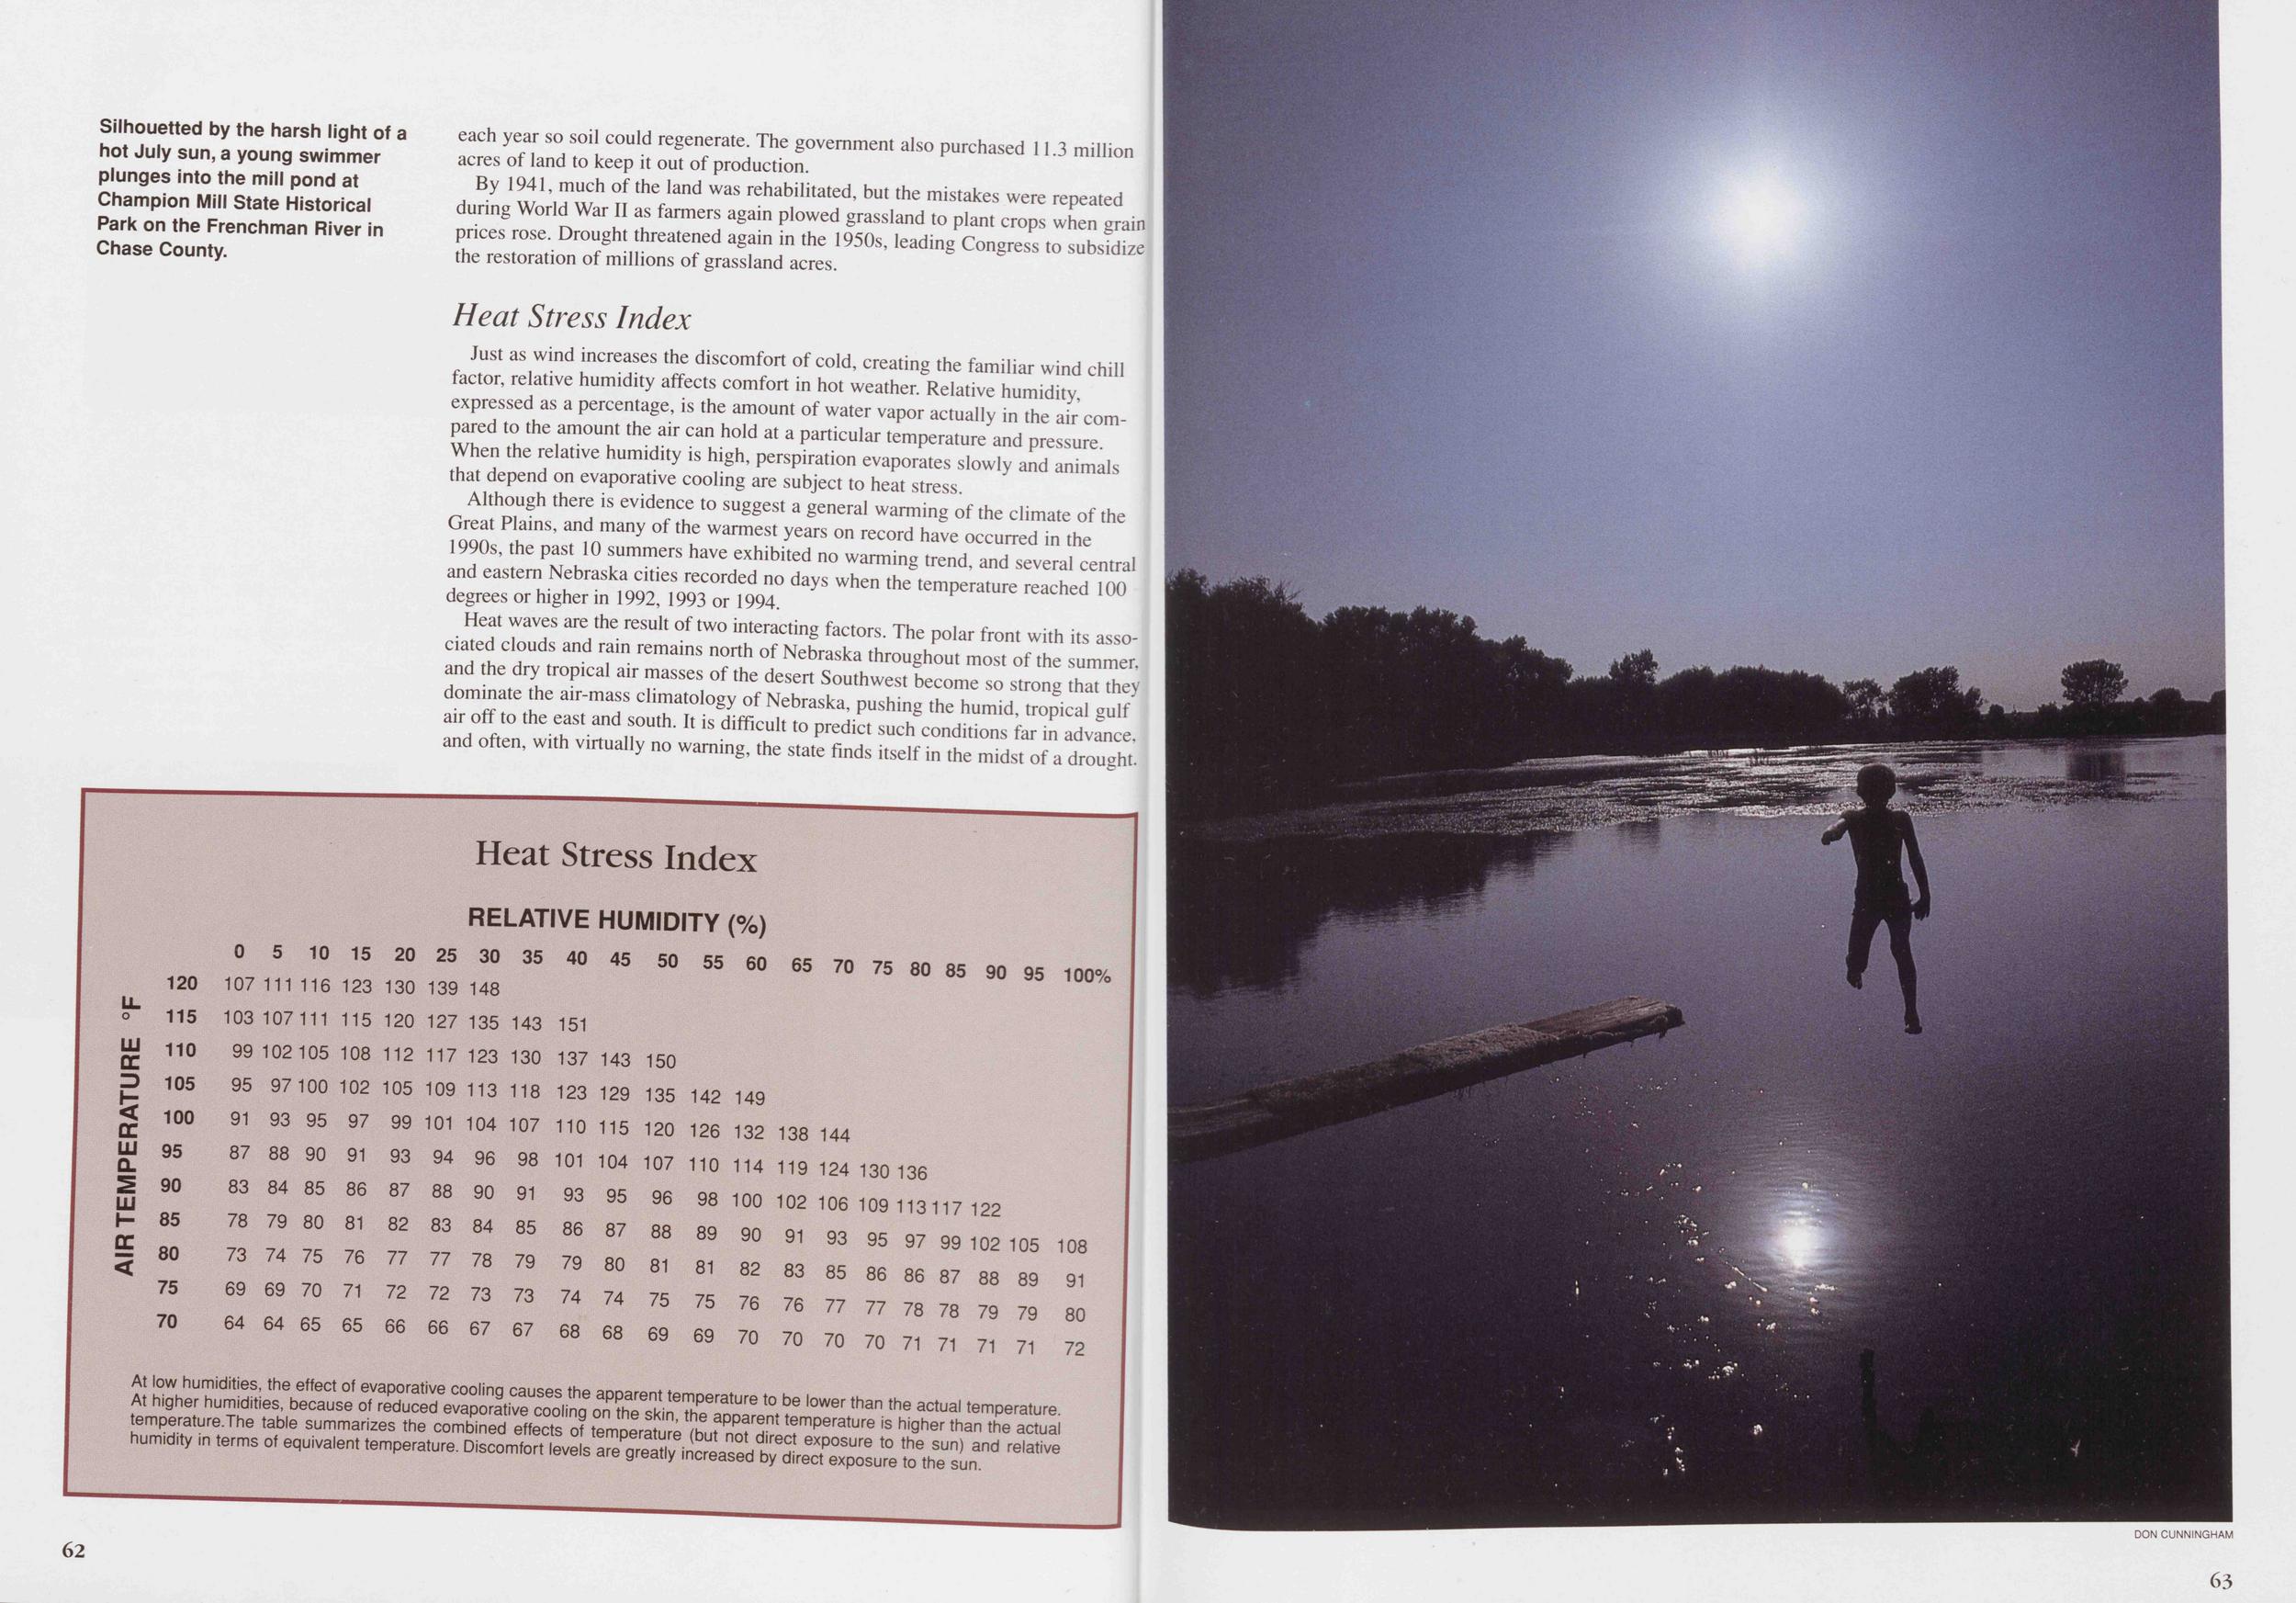
By 1941, much of the land was rehabilitated, but the mistakes were repeated during World War II as farmers again plowed grassland to plant crops when grain prices rose. Drought threatened again in the 1950s, leading Congress to subsidize the restoration of millions of grassland acres.
Heat Stress IndexJust as wind increases the discomfort of cold, creating the familiar wind chill factor, relative humidity affects comfort in hot weather. Relative humidity, expressed as a percentage, is the amount of water vapor actually in the air compared to the amount the air can hold at a particular temperature and pressure. When the relative humidity is high, perspiration evaporates slowly and animals that depend on evaporative cooling are subject to heat stress.
Although there is evidence to suggest a general warming of the climate of the Great Plains, and many of the warmest years on record have occurred in the 1990s, the past 10 summers have exhibited no warming trend, and several central and eastern Nebraska cities recorded no days when the temperature reached 100 degrees or higher in 1992, 1993 or 1994.
Heat waves are the result of two interacting factors. The polar front with its associated clouds and rain remains north of Nebraska throughout most of the summer, and the dry tropical air masses of the desert Southwest become so strong that they dominate the air-mass climatology of Nebraska, pushing the humid, tropical gulf air off to the east and south. It is difficult to predict such conditions far in advance, and often, with virtually no warning, the state finds itself in the midst of a drought.
Heat Stress Index 120 115 110 105 100 95 90 85 80 75 70 RELATIVE HUMIDITY (%) 0 5 10 15 20 25 30 35 40 45 50 55 60 65 70 75 80 85 90 95 100% 107 111 116 123 130 139 148 103 107111 115 120 127 135 143 151 99 102 105 108 112 117 123 130 137 143 150 95 97 100 102 105 109 113 118 123 129 135 142 149 93 95 97 99 101 104 107 110 115 120 126 132 138 144 94 96 98 101 104 107 110 114 119 124 130 136 91 87 88 90 91 93 83 84 85 86 87 78 79 80 81 88 90 91 82 83 84 85 73 74 75 76 77 77 78 79 69 69 70 71 72 72 73 73 93 95 86 87 79 80 74 74 64 64 65 65 66 66 67 67 68 68 96 98 100 102 106 109 113117 122 88 89 90 91 93 95 97 99 102 105 108 81 81 82 83 85 86 86 87 88 89 91 75 75 76 76 77 77 78 78 79 79 80 69 69 70 70 70 70 71 71 71 71 72 At low humidities, the effect of evaporative cooling causes the apparent temperature to be lower than the actual temperature. At higher humidities, because of reduced evaporative cooling on the skin, the apparent temperature is higher than the actual temperature.The table summarizes the combined effects of temperature (but not direct exposure to the sun) and relative humidity in terms of equivalent temperature. Discomfort levels are greatly increased by direct exposure to the sun. 62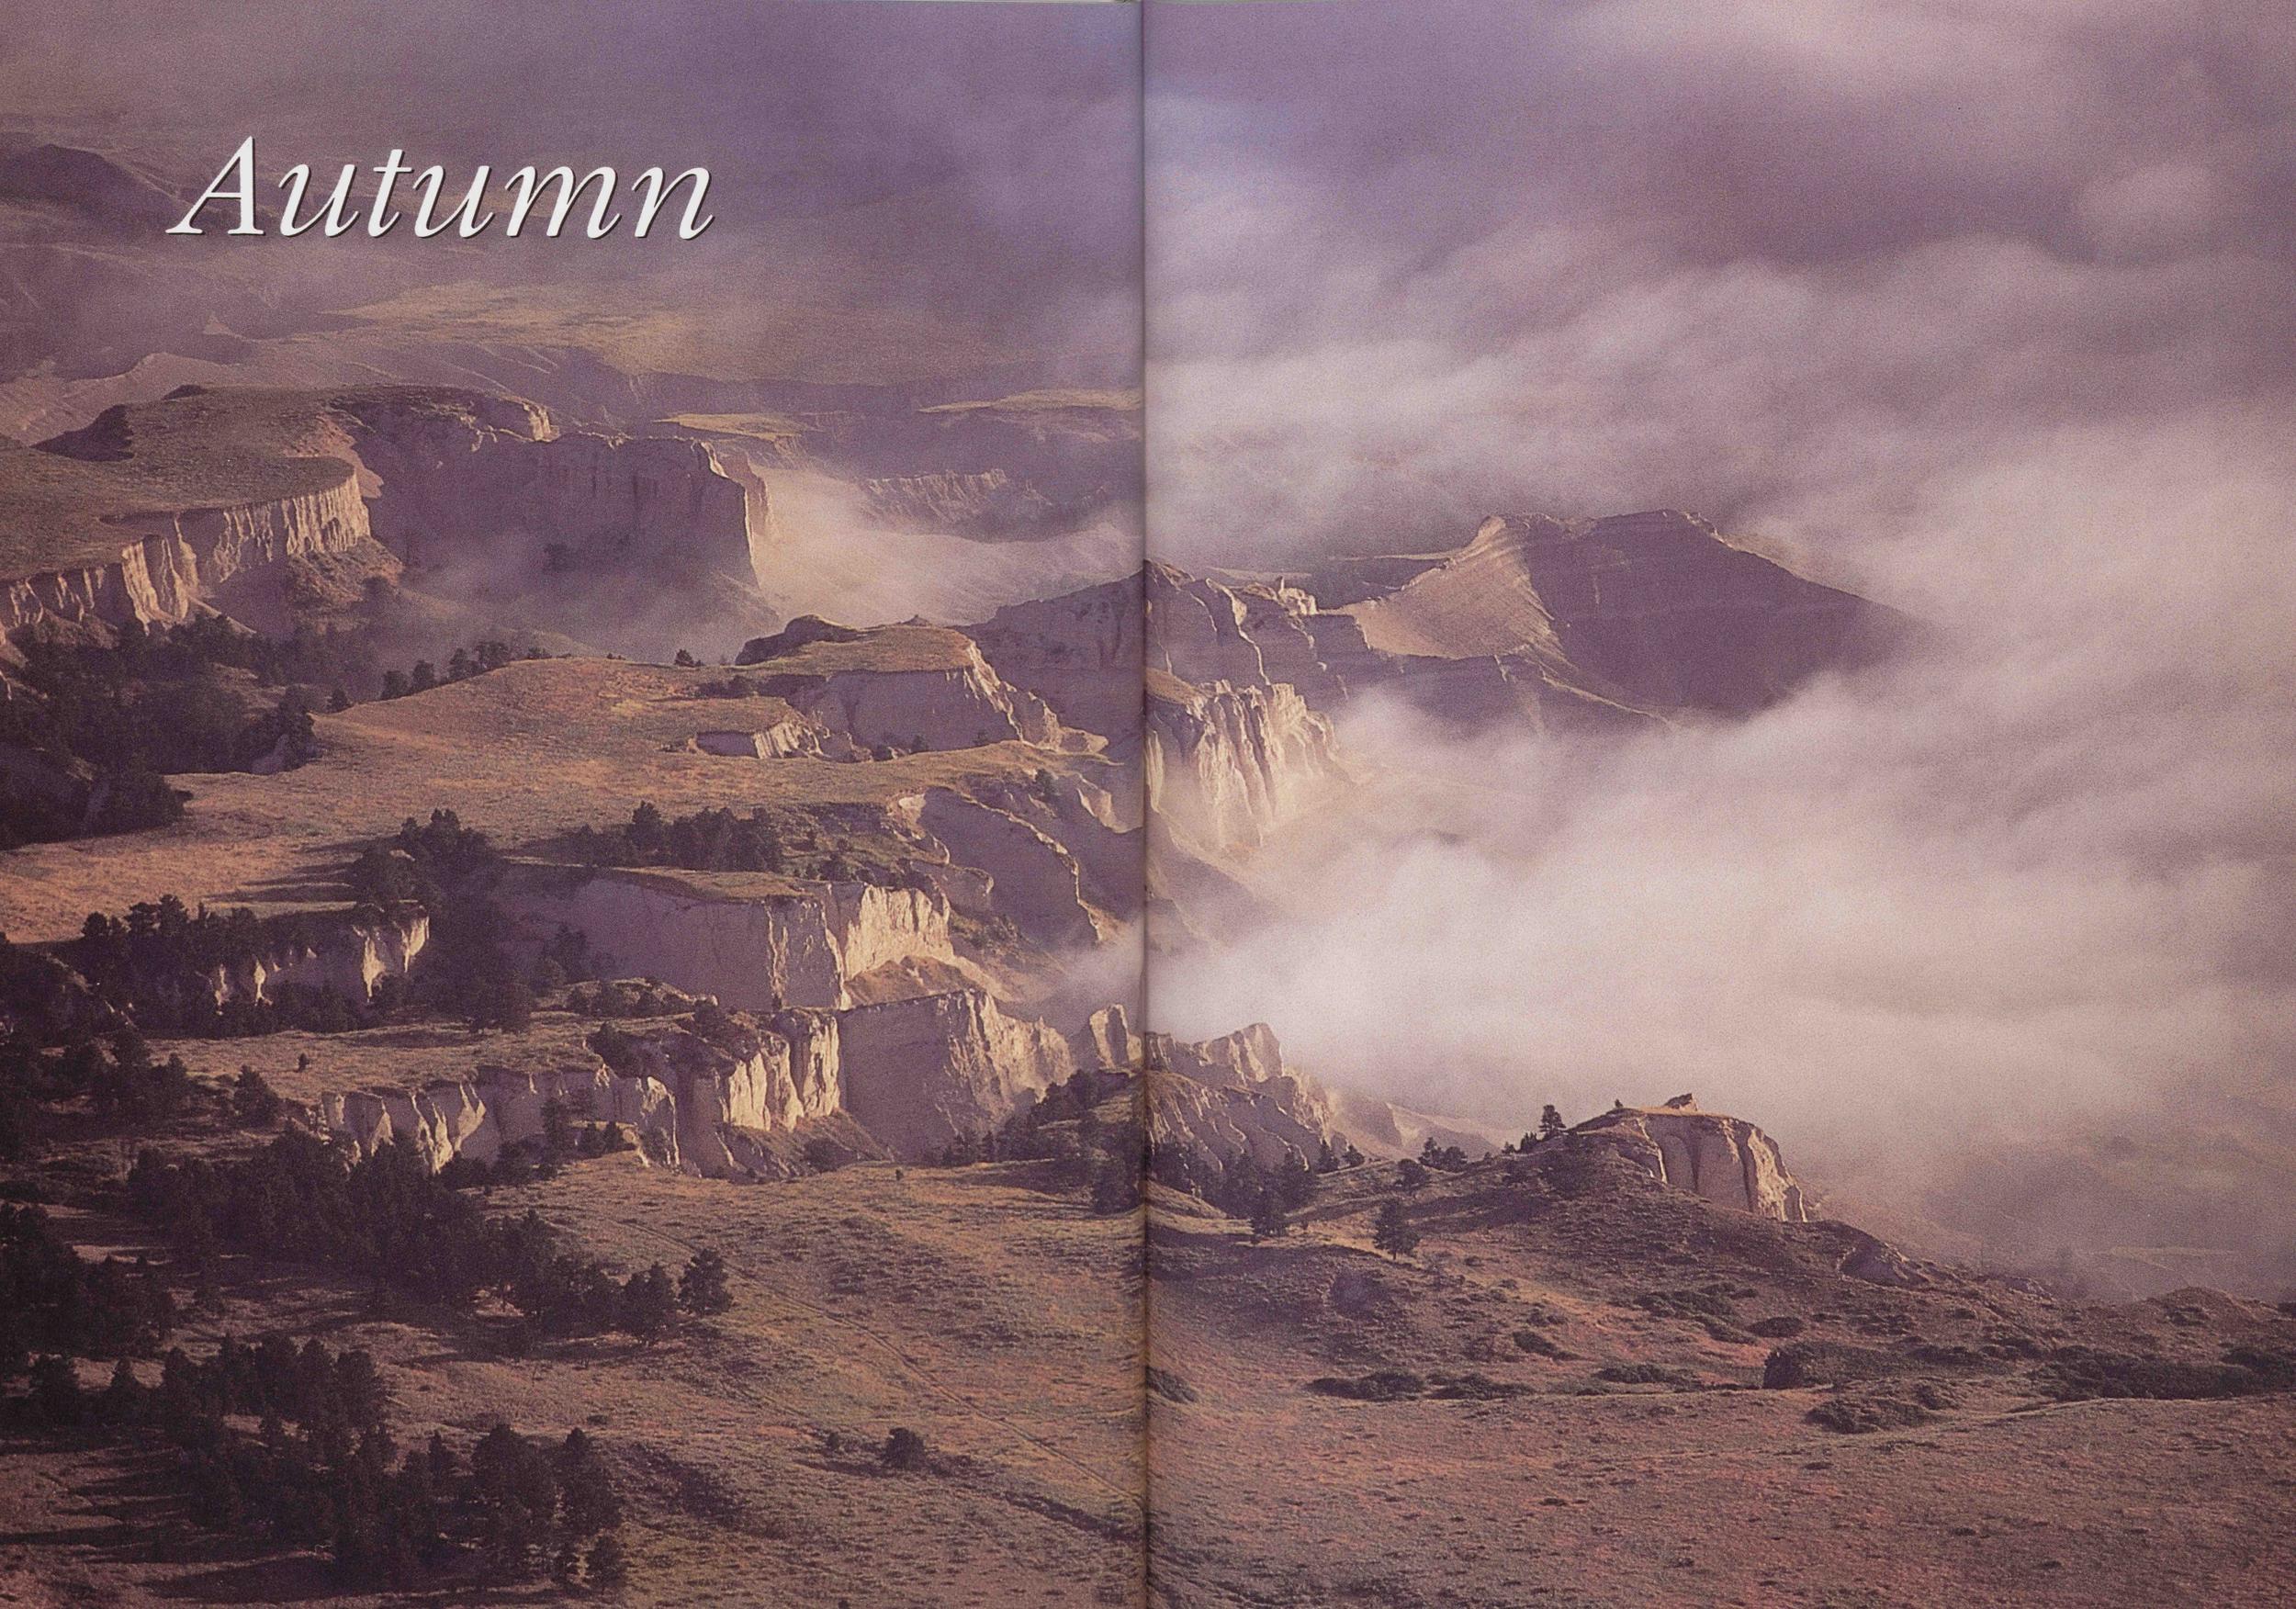
Autumn
Autumn A Season of Change
By Rick Clark and Eric Grelson Department of Geography, University of Nebraska-LincolnIN SEPTEMBER, shortening days pave the way for cooler temperatures and changing leaf colors, the most obvious signs that summer is but a memory. Ripening fields mean that harvest is fast approaching, soon to be followed by the icy grip of winter. Autumn brings a host of familiar sensations. The excitement of an afternoon football game is especially poignant to many Nebraskans, and the smell of burning leaves takes some people back to days when raked-up piles could be burned, filling the autumn air with haze and a pungent aroma. A harvest moon lights the evening sky. Many Nebraskans who move to the more moderate climates of other states miss the changing of the seasons, especially the transition from summer to autumn, more than anything else.
Earth and SunEven though the amount and intensity of sunlight decrease after the summer solstice about June 21, the longest day of the year in the Northern Hemisphere, Nebraska's temperatures usually continue to increase into July. Usually about mid-July, Nebraska experiences its hottest weather, with afternoon highs averaging almost 90 degrees. Nebraska's highest dew points, reflecting the greatest amounts of moisture in the air, come shortly thereafter, usually in the first and second weeks of August, and Nebraskans look forward to autumn as a refreshing change to cooler temperatures and lower humidity.
As children leave behind swimming pools and outdoor frolicking to head back to school and adults leave behind weekend barbecues to put storm windows on the house, the landscape is transformed. Usually in early September, the trees begin to show their autumn colors.
Although lower temperatures can affect the color change, shorter days are the primary reason for the autumnal colors. Even if summer heat lasts through September and into October, the leaves still change, because chlorophyll, the green pigment in plant leaves, is highly sensitive to solar radiation and breaks down as the photoperiod decreases. After the chlorophyll breaks down, yellow and red pigments remaining in the leaves color the autumn landscape.
At the autumnal equinox, the astronomical beginning of autumn on about September 21, day and night are about the same length. By that date, the average high temperature in Nebraska has decreased into the low 70s. The photoperiod continues to decrease, and as days become shorter than nights, the Northern Hemisphere loses more energy at night through radiative cooling than it gains from solar radiation during the day. This negative "energy budget" causes temperatures to continue dropping as autumn fades into winter.
67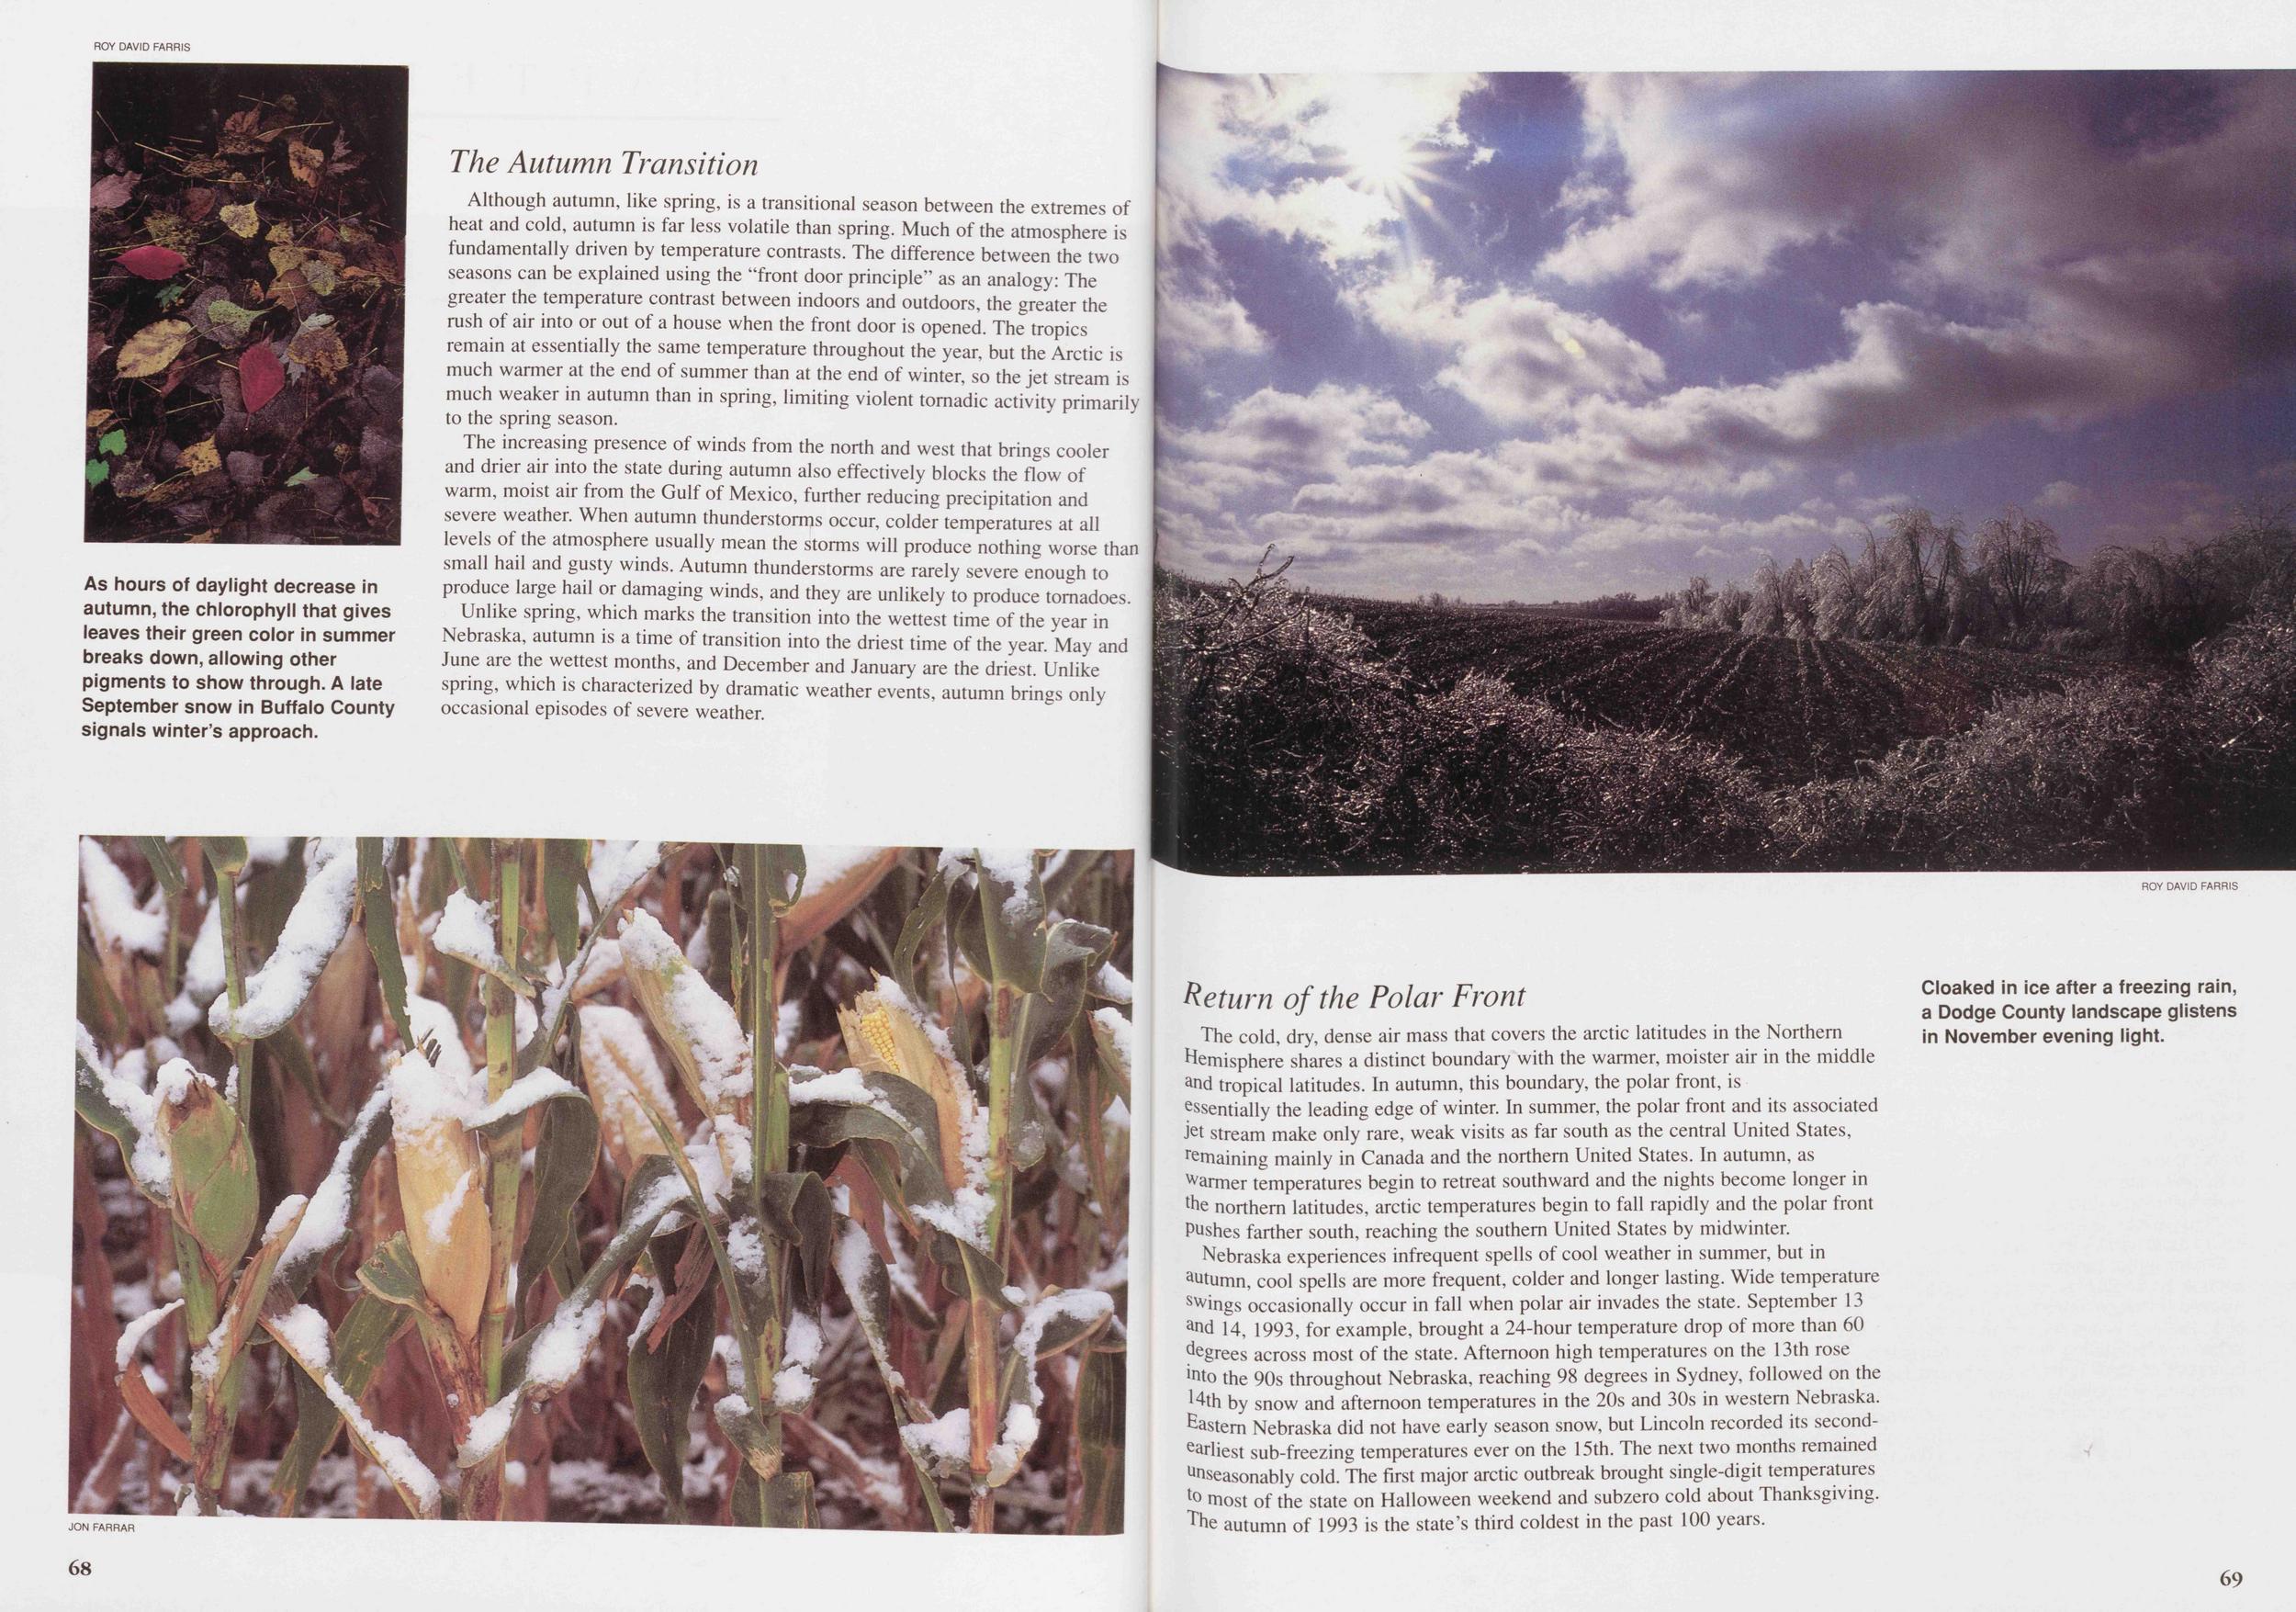
Although autumn, like spring, is a transitional season between the extremes of heat and cold, autumn is far less volatile than spring. Much of the atmosphere is fundamentally driven by temperature contrasts. The difference between the two seasons can be explained using the "front door principle" as an analogy: The greater the temperature contrast between indoors and outdoors, the greater the rush of air into or out of a house when the front door is opened. The tropics remain at essentially the same temperature throughout the year, but the Arctic is much warmer at the end of summer than at the end of winter, so the jet stream is much weaker in autumn than in spring, limiting violent tornadic activity primarily to the spring season.
The increasing presence of winds from the north and west that brings cooler and drier air into the state during autumn also effectively blocks the flow of warm, moist air from the Gulf of Mexico, further reducing precipitation and severe weather. When autumn thunderstorms occur, colder temperatures at all levels of the atmosphere usually mean the storms will produce nothing worse than small hail and gusty winds. Autumn thunderstorms are rarely severe enough to produce large hail or damaging winds, and they are unlikely to produce tornadoes.
Unlike spring, which marks the transition into the wettest time of the year in Nebraska, autumn is a time of transition into the driest time of the year. May and June are the wettest months, and December and January are the driest. Unlike spring, which is characterized by dramatic weather events, autumn brings only occasional episodes of severe weather.
The cold, dry, dense air mass that covers the arctic latitudes in the Northern Hemisphere shares a distinct boundary with the warmer, moister air in the middle and tropical latitudes. In autumn, this boundary, the polar front, is essentially the leading edge of winter. In summer, the polar front and its associated Jet stream make only rare, weak visits as far south as the central United States, remaining mainly in Canada and the northern United States. In autumn, as farmer temperatures begin to retreat southward and the nights become longer in me northern latitudes, arctic temperatures begin to fall rapidly and the polar front Pushes farther south, reaching the southern United States by midwinter.
Nebraska experiences infrequent spells of cool weather in summer, but in autumn, cool spells are more frequent, colder and longer lasting. Wide temperature occasionally occur in fall when polar air invades the state. September 13 arid i4? 1993 for example, brought a 24-hour temperature drop of more than 60 Agrees across most of the state. Afternoon high temperatures on the 13th rose into the 90s throughout Nebraska, reaching 98 degrees in Sydney, followed on the 14th by snow and afternoon temperatures in the 20s and 30s in western Nebraska. Astern Nebraska did not have early season snow, but Lincoln recorded its second earliest sub-freezing temperatures ever on the 15th. The next two months remained seasonably cold. The first major arctic outbreak brought single-digit temperatures to most of the state on Halloween weekend and subzero cold about Thanksgiving, ^he autumn of 1993 is the state's third coldest in the past 100 years.
69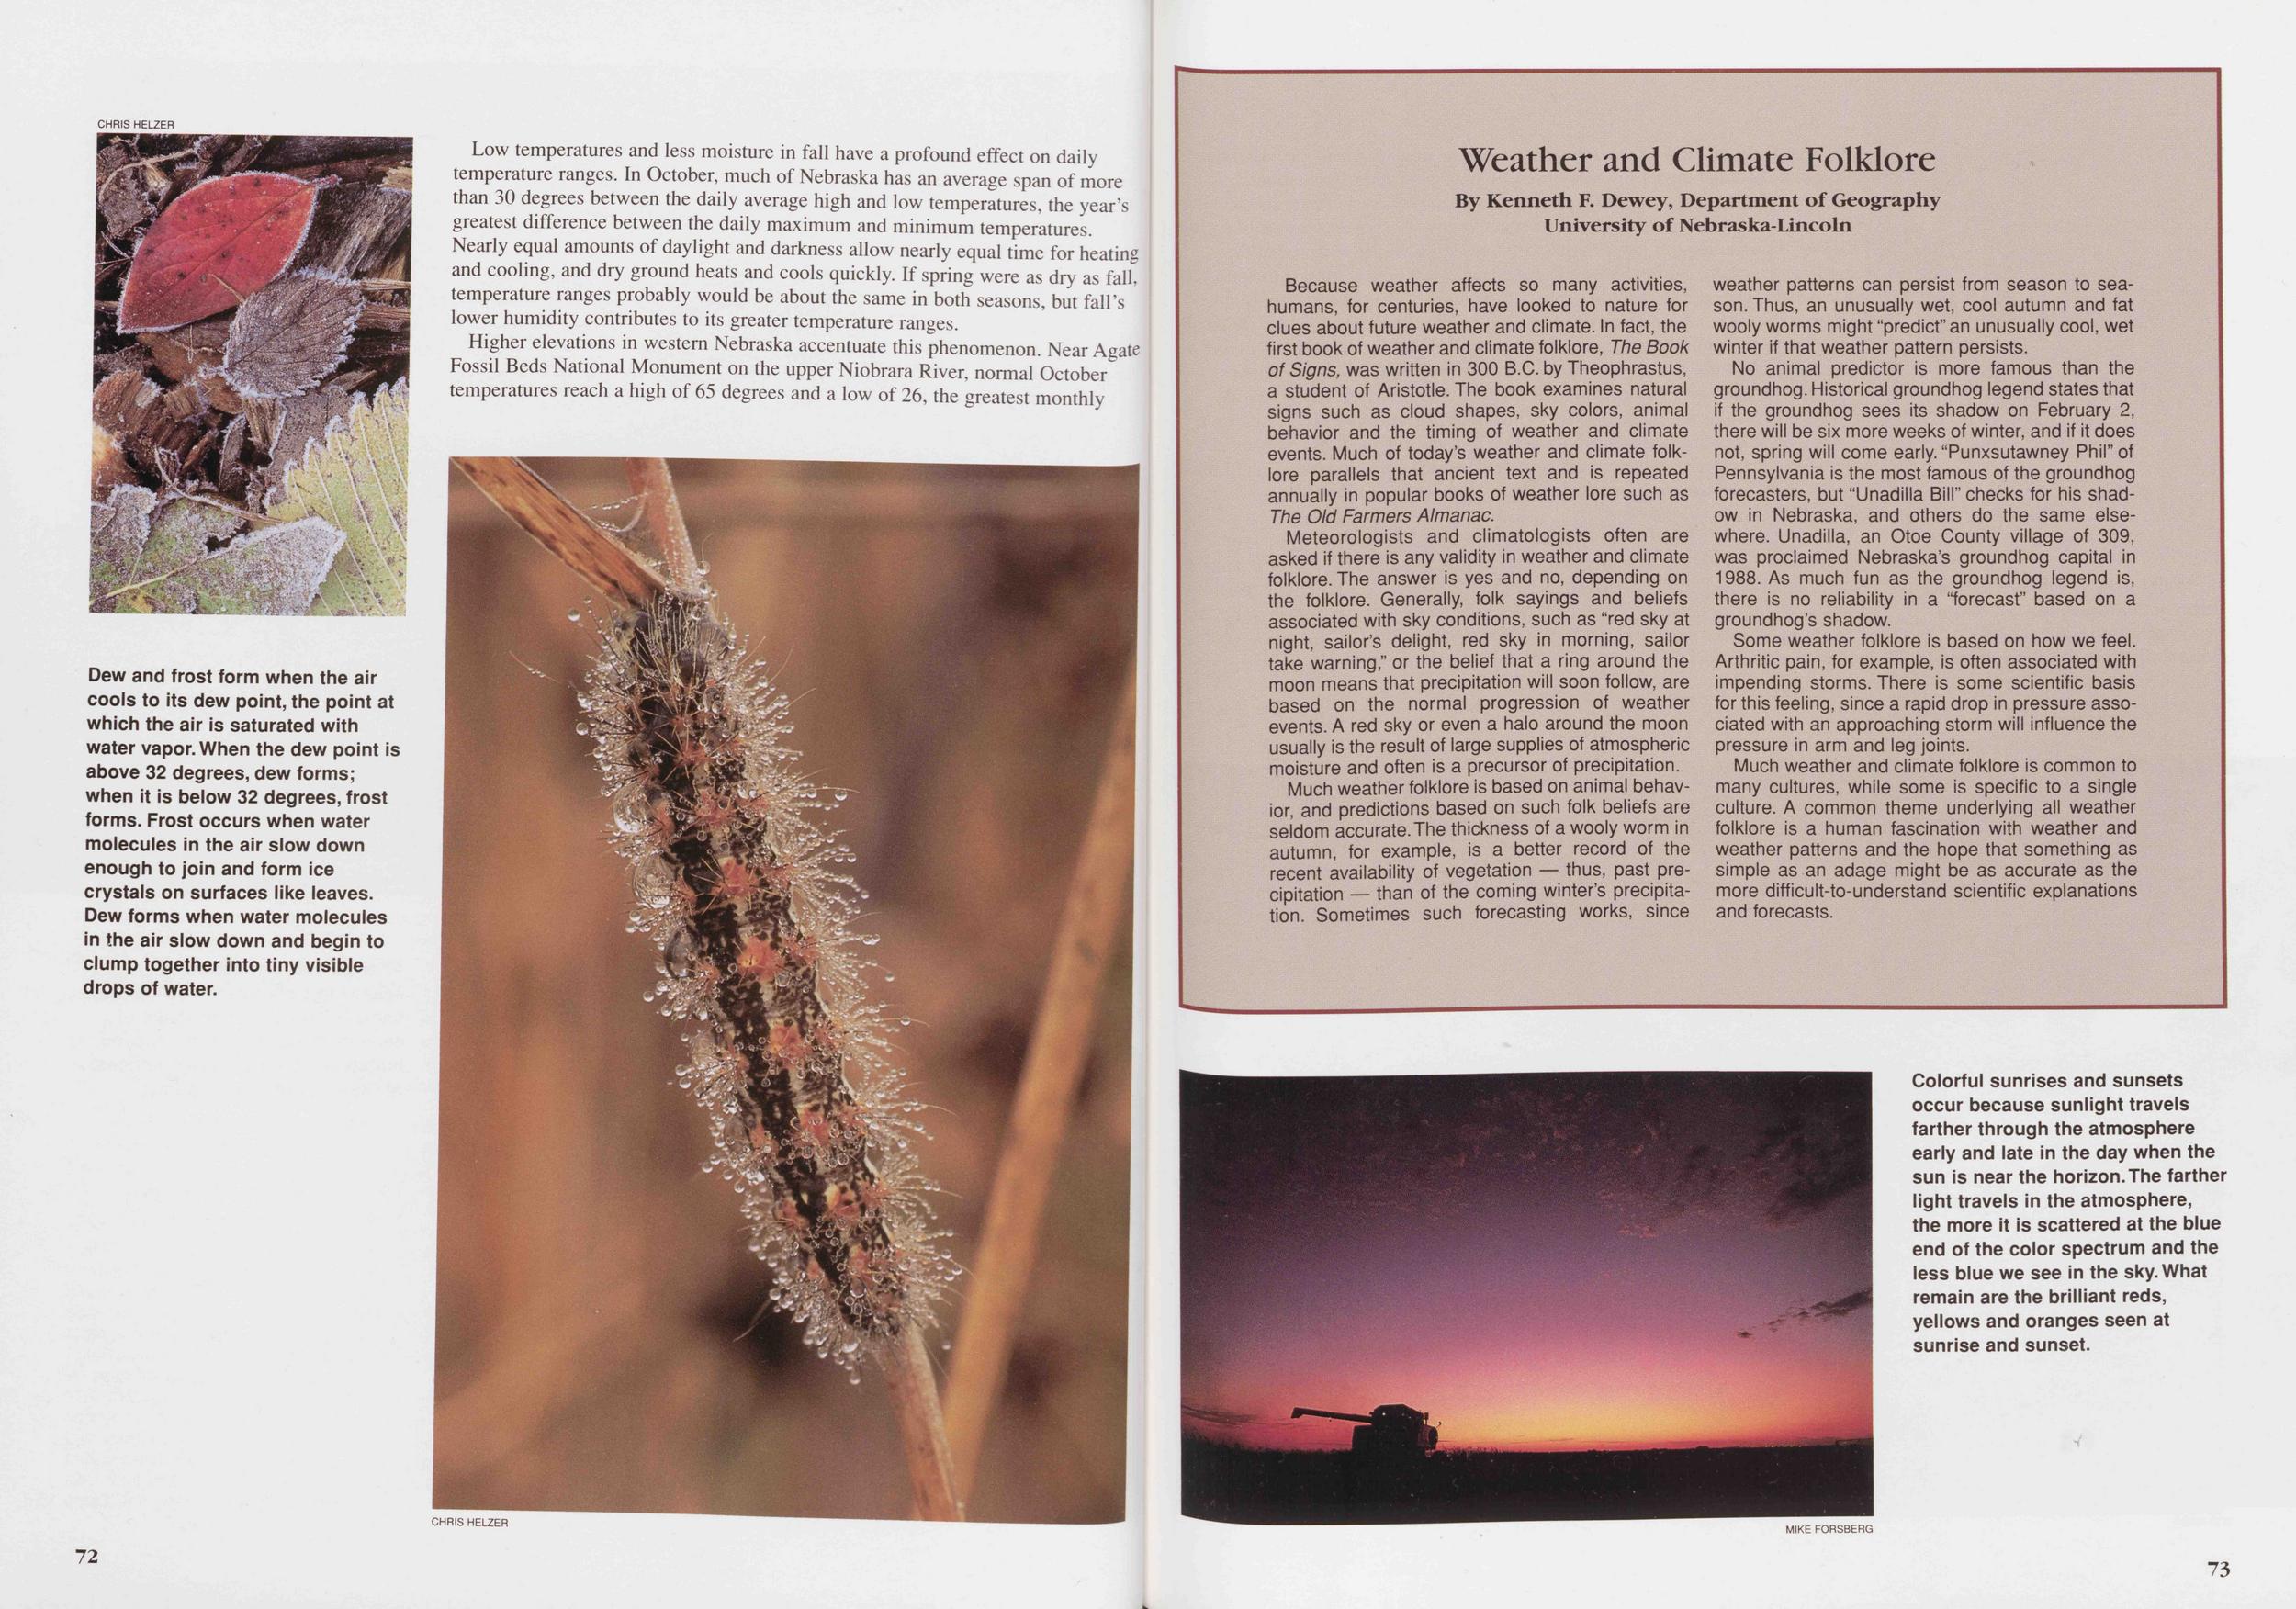
Low temperatures and less moisture in fall have a profound effect on daily temperature ranges. In October, much of Nebraska has an average span of more than 30 degrees between the daily average high and low temperatures, the year's greatest difference between the daily maximum and minimum temperatures. Nearly equal amounts of daylight and darkness allow nearly equal time for heating and cooling, and dry ground heats and cools quickly. If spring were as dry as fall! temperature ranges probably would be about the same in both seasons, but fall's lower humidity contributes to its greater temperature ranges.
Higher elevations in western Nebraska accentuate this phenomenon. Near Agate Fossil Beds National Monument on the upper Niobrara River, normal October" temperatures reach a high of 65 degrees and a low of 26, the greatest monthly temperature range in the state. Temperature ranges are smaller in the east, where lower elevation and higher humidity prevent such wide daily fluctuations'
Because weather affects so many activities, humans, for centuries, have looked to nature for clues about future weather and climate. In fact, the first book of weather and climate folklore, The Book of Signs, was written in 300 B.C. by Theophrastus, a student of Aristotle. The book examines natural signs such as cloud shapes, sky colors, animal behavior and the timing of weather and climate events. Much of today's weather and climate folklore parallels that ancient text and is repeated annually in popular books of weather lore such as The Old Farmers Almanac.
Meteorologists and climatologists often are asked if there is any validity in weather and climate folklore. The answer is yes and no, depending on the folklore. Generally, folk sayings and beliefs associated with sky conditions, such as "red sky at night, sailor's delight, red sky in morning, sailor take warning," or the belief that a ring around the moon means that precipitation will soon follow, are based on the normal progression of weather events. A red sky or even a halo around the moon usually is the result of large supplies of atmospheric moisture and often is a precursor of precipitation.
Much weather folklore is based on animal behavior, and predictions based on such folk beliefs are seldom accurate. The thickness of a wooly worm in autumn, for example, is a better record of the recent availability of vegetation — thus, past precipitation — than of the coming winter's precipitation. Sometimes such forecasting works, since weather patterns can persist from season to season. Thus, an unusually wet, cool autumn and fat wooly worms might "predict" an unusually cool, wet winter if that weather pattern persists.
No animal predictor is more famous than the groundhog. Historical groundhog legend states that if the groundhog sees its shadow on February 2, there will be six more weeks of winter, and if it does not, spring will come early. "Punxsutawney Phil" of Pennsylvania is the most famous of the groundhog forecasters, but "Unadilla Bill" checks for his shadow in Nebraska, and others do the same elsewhere. Unadilla, an Otoe County village of 309, was proclaimed Nebraska's groundhog capital in 1988. As much fun as the groundhog legend is, there is no reliability in a "forecast" based on a groundhog's shadow.
Some weather folklore is based on how we feel. Arthritic pain, for example, is often associated with impending storms. There is some scientific basis for this feeling, since a rapid drop in pressure associated with an approaching storm will influence the pressure in arm and leg joints.
Much weather and climate folklore is common to many cultures, while some is specific to a single culture. A common theme underlying all weather folklore is a human fascination with weather and weather patterns and the hope that something as simple as an adage might be as accurate as the more difficult-to-understand scientific explanations and forecasts.
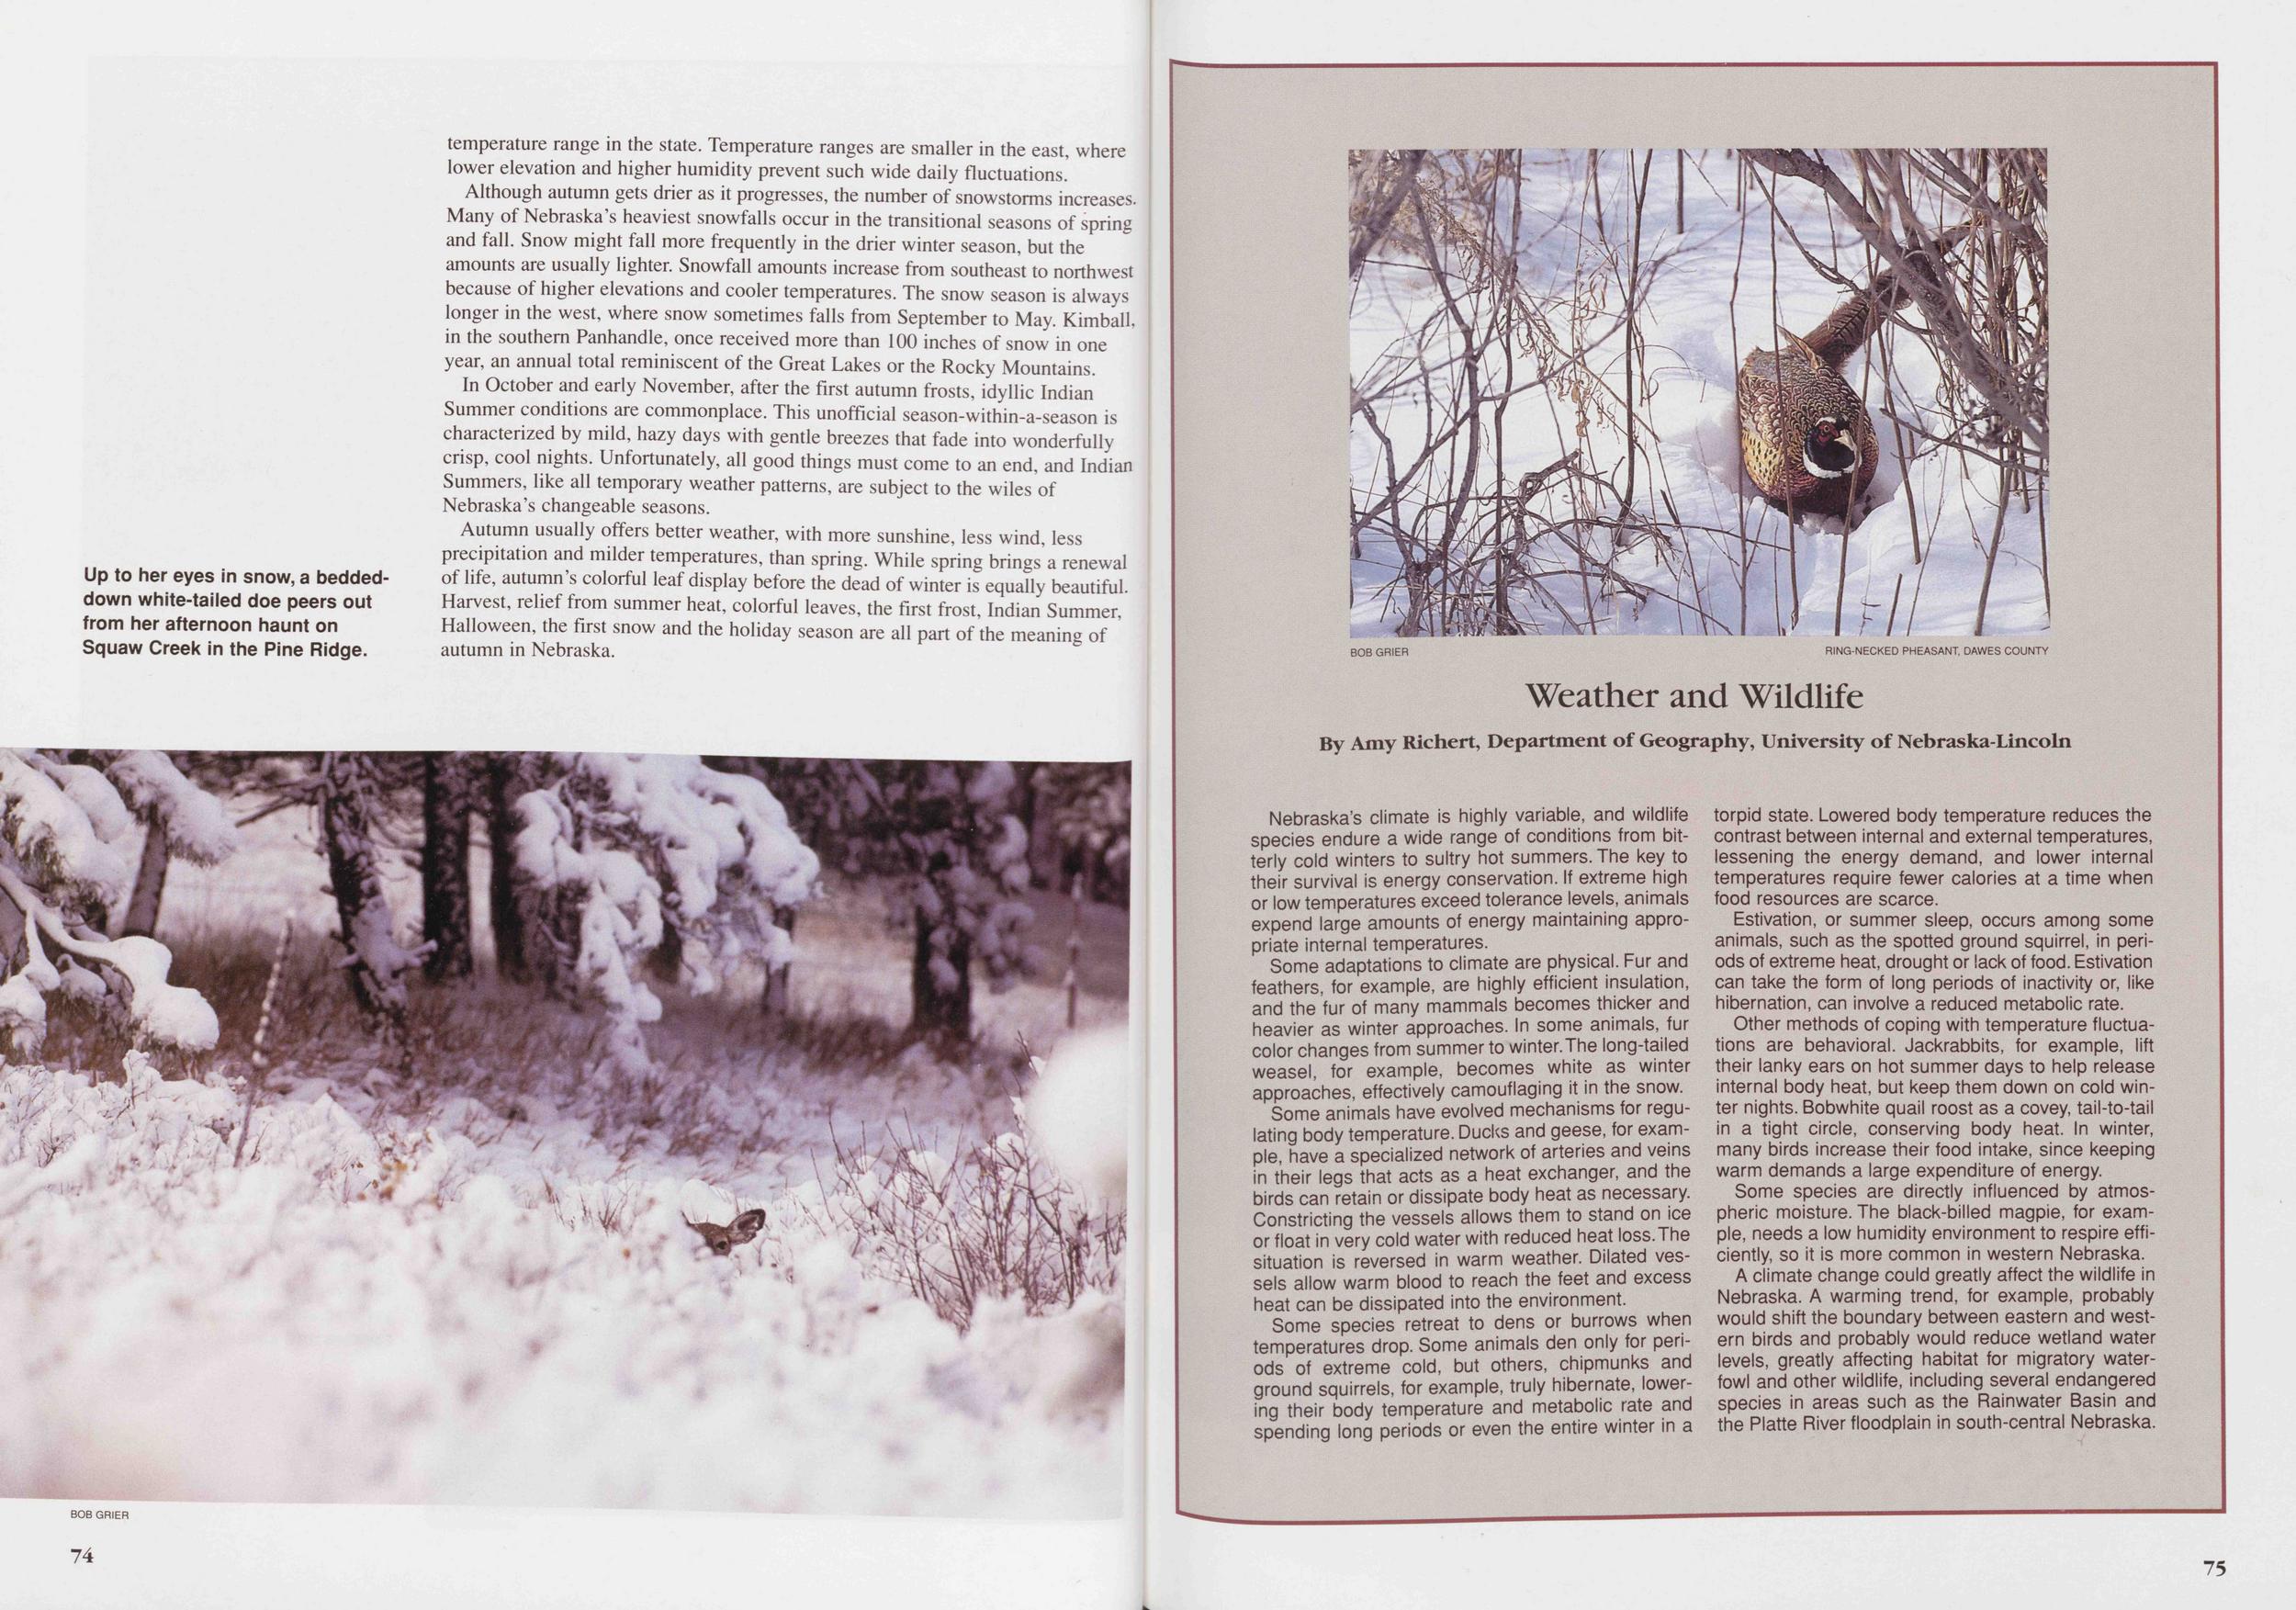
Although autumn gets drier as it progresses, the number of snowstorms increases. Many of Nebraska's heaviest snowfalls occur in the transitional seasons of spring and fall. Snow might fall more frequently in the drier winter season, but the amounts are usually lighter. Snowfall amounts increase from southeast to northwest because of higher elevations and cooler temperatures. The snow season is always longer in the west, where snow sometimes falls from September to May. Kimball, in the southern Panhandle, once received more than 100 inches of snow in one year, an annual total reminiscent of the Great Lakes or the Rocky Mountains.
In October and early November, after the first autumn frosts, idyllic Indian Summer conditions are commonplace. This unofficial season-within-a-season is characterized by mild, hazy days with gentle breezes that fade into wonderfully crisp, cool nights. Unfortunately, all good things must come to an end, and Indian Summers, like all temporary weather patterns, are subject to the wiles of Nebraska's changeable seasons.
Autumn usually offers better weather, with more sunshine, less wind, less precipitation and milder temperatures, than spring. While spring brings'a renewal of life, autumn's colorful leaf display before the dead of winter is equally beautiful. Harvest, relief from summer heat, colorful leaves, the first frost, Indian Summer, Halloween, the first snow and the holiday season are all part of the meaning of autumn in Nebraska.
74Nebraska's climate is highly variable, and wildlife species endure a wide range of conditions from bitterly cold winters to sultry hot summers. The key to their survival is energy conservation. If extreme high or low temperatures exceed tolerance levels, animals expend large amounts of energy maintaining appropriate internal temperatures.
Some adaptations to climate are physical. Fur and feathers, for example, are highly efficient insulation, and the fur of many mammals becomes thicker and heavier as winter approaches. In some animals, fur color changes from summer to winter.The long-tailed weasel, for example, becomes white as winter approaches, effectively camouflaging it in the snow.
Some animals have evolved mechanisms for regulating body temperature. Ducks and geese, for example, have a specialized network of arteries and veins in their legs that acts as a heat exchanger, and the birds can retain or dissipate body heat as necessary. Constricting the vessels allows them to stand on ice or float in very cold water with reduced heat loss.The situation is reversed in warm weather. Dilated vessels allow warm blood to reach the feet and excess heat can be dissipated into the environment.
Some species retreat to dens or burrows when temperatures drop. Some animals den only for periods of extreme cold, but others, chipmunks and ground squirrels, for example, truly hibernate, lowering their body temperature and metabolic rate and spending long periods or even the entire winter in a torpid state. Lowered body temperature reduces the contrast between internal and external temperatures, lessening the energy demand, and lower internal temperatures require fewer calories at a time when food resources are scarce.
Estivation, or summer sleep, occurs among some animals, such as the spotted ground squirrel, in periods of extreme heat, drought or lack of food. Estivation can take the form of long periods of inactivity or, like hibernation, can involve a reduced metabolic rate.
Other methods of coping with temperature fluctuations are behavioral. Jackrabbits, for example, lift their lanky ears on hot summer days to help release internal body heat, but keep them down on cold winter nights. Bobwhite quail roost as a covey, tail-to-tail in a tight circle, conserving body heat. In winter, many birds increase their food intake, since keeping warm demands a large expenditure of energy.
Some species are directly influenced by atmospheric moisture. The black-billed magpie, for example, needs a low humidity environment to respire efficiently, so it is more common in western Nebraska.
A climate change could greatly affect the wildlife in Nebraska. A warming trend, for example, probably would shift the boundary between eastern and western birds and probably would reduce wetland water levels, greatly affecting habitat for migratory waterfowl and other wildlife, including several endangered species in areas such as the Rainwater Basin and the Platte River floodplain in south-central Nebraska.
75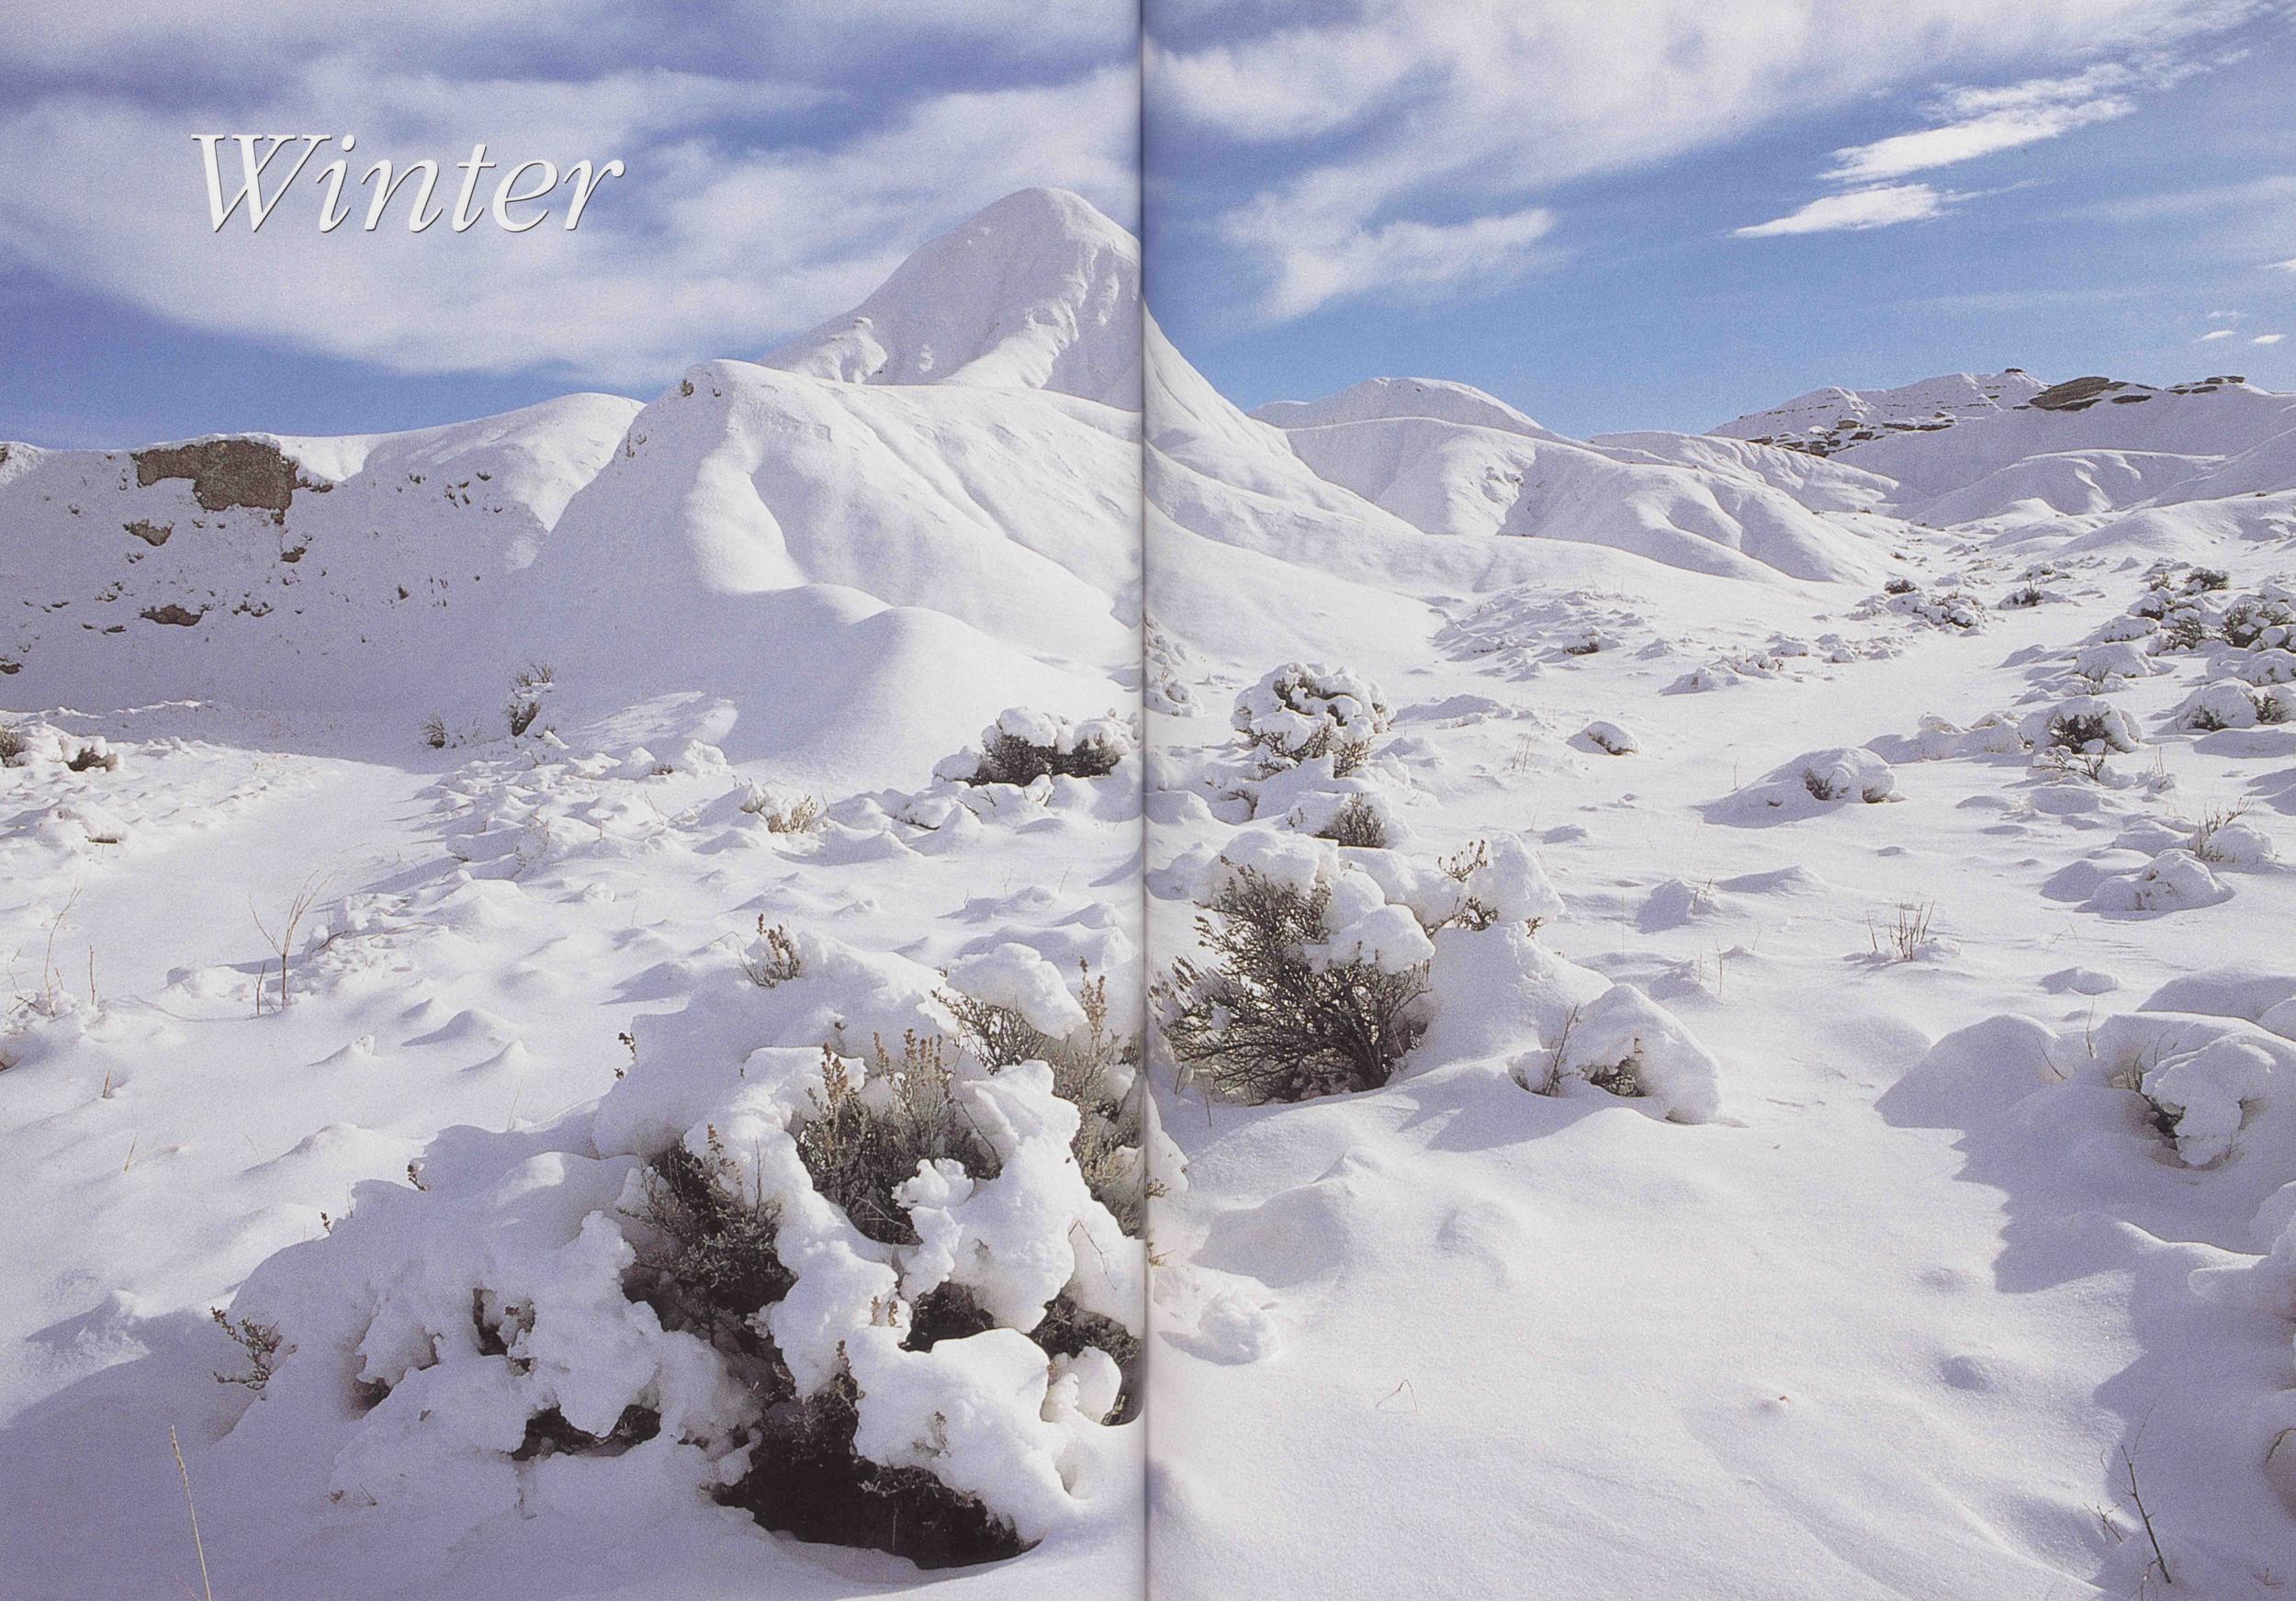
Winter
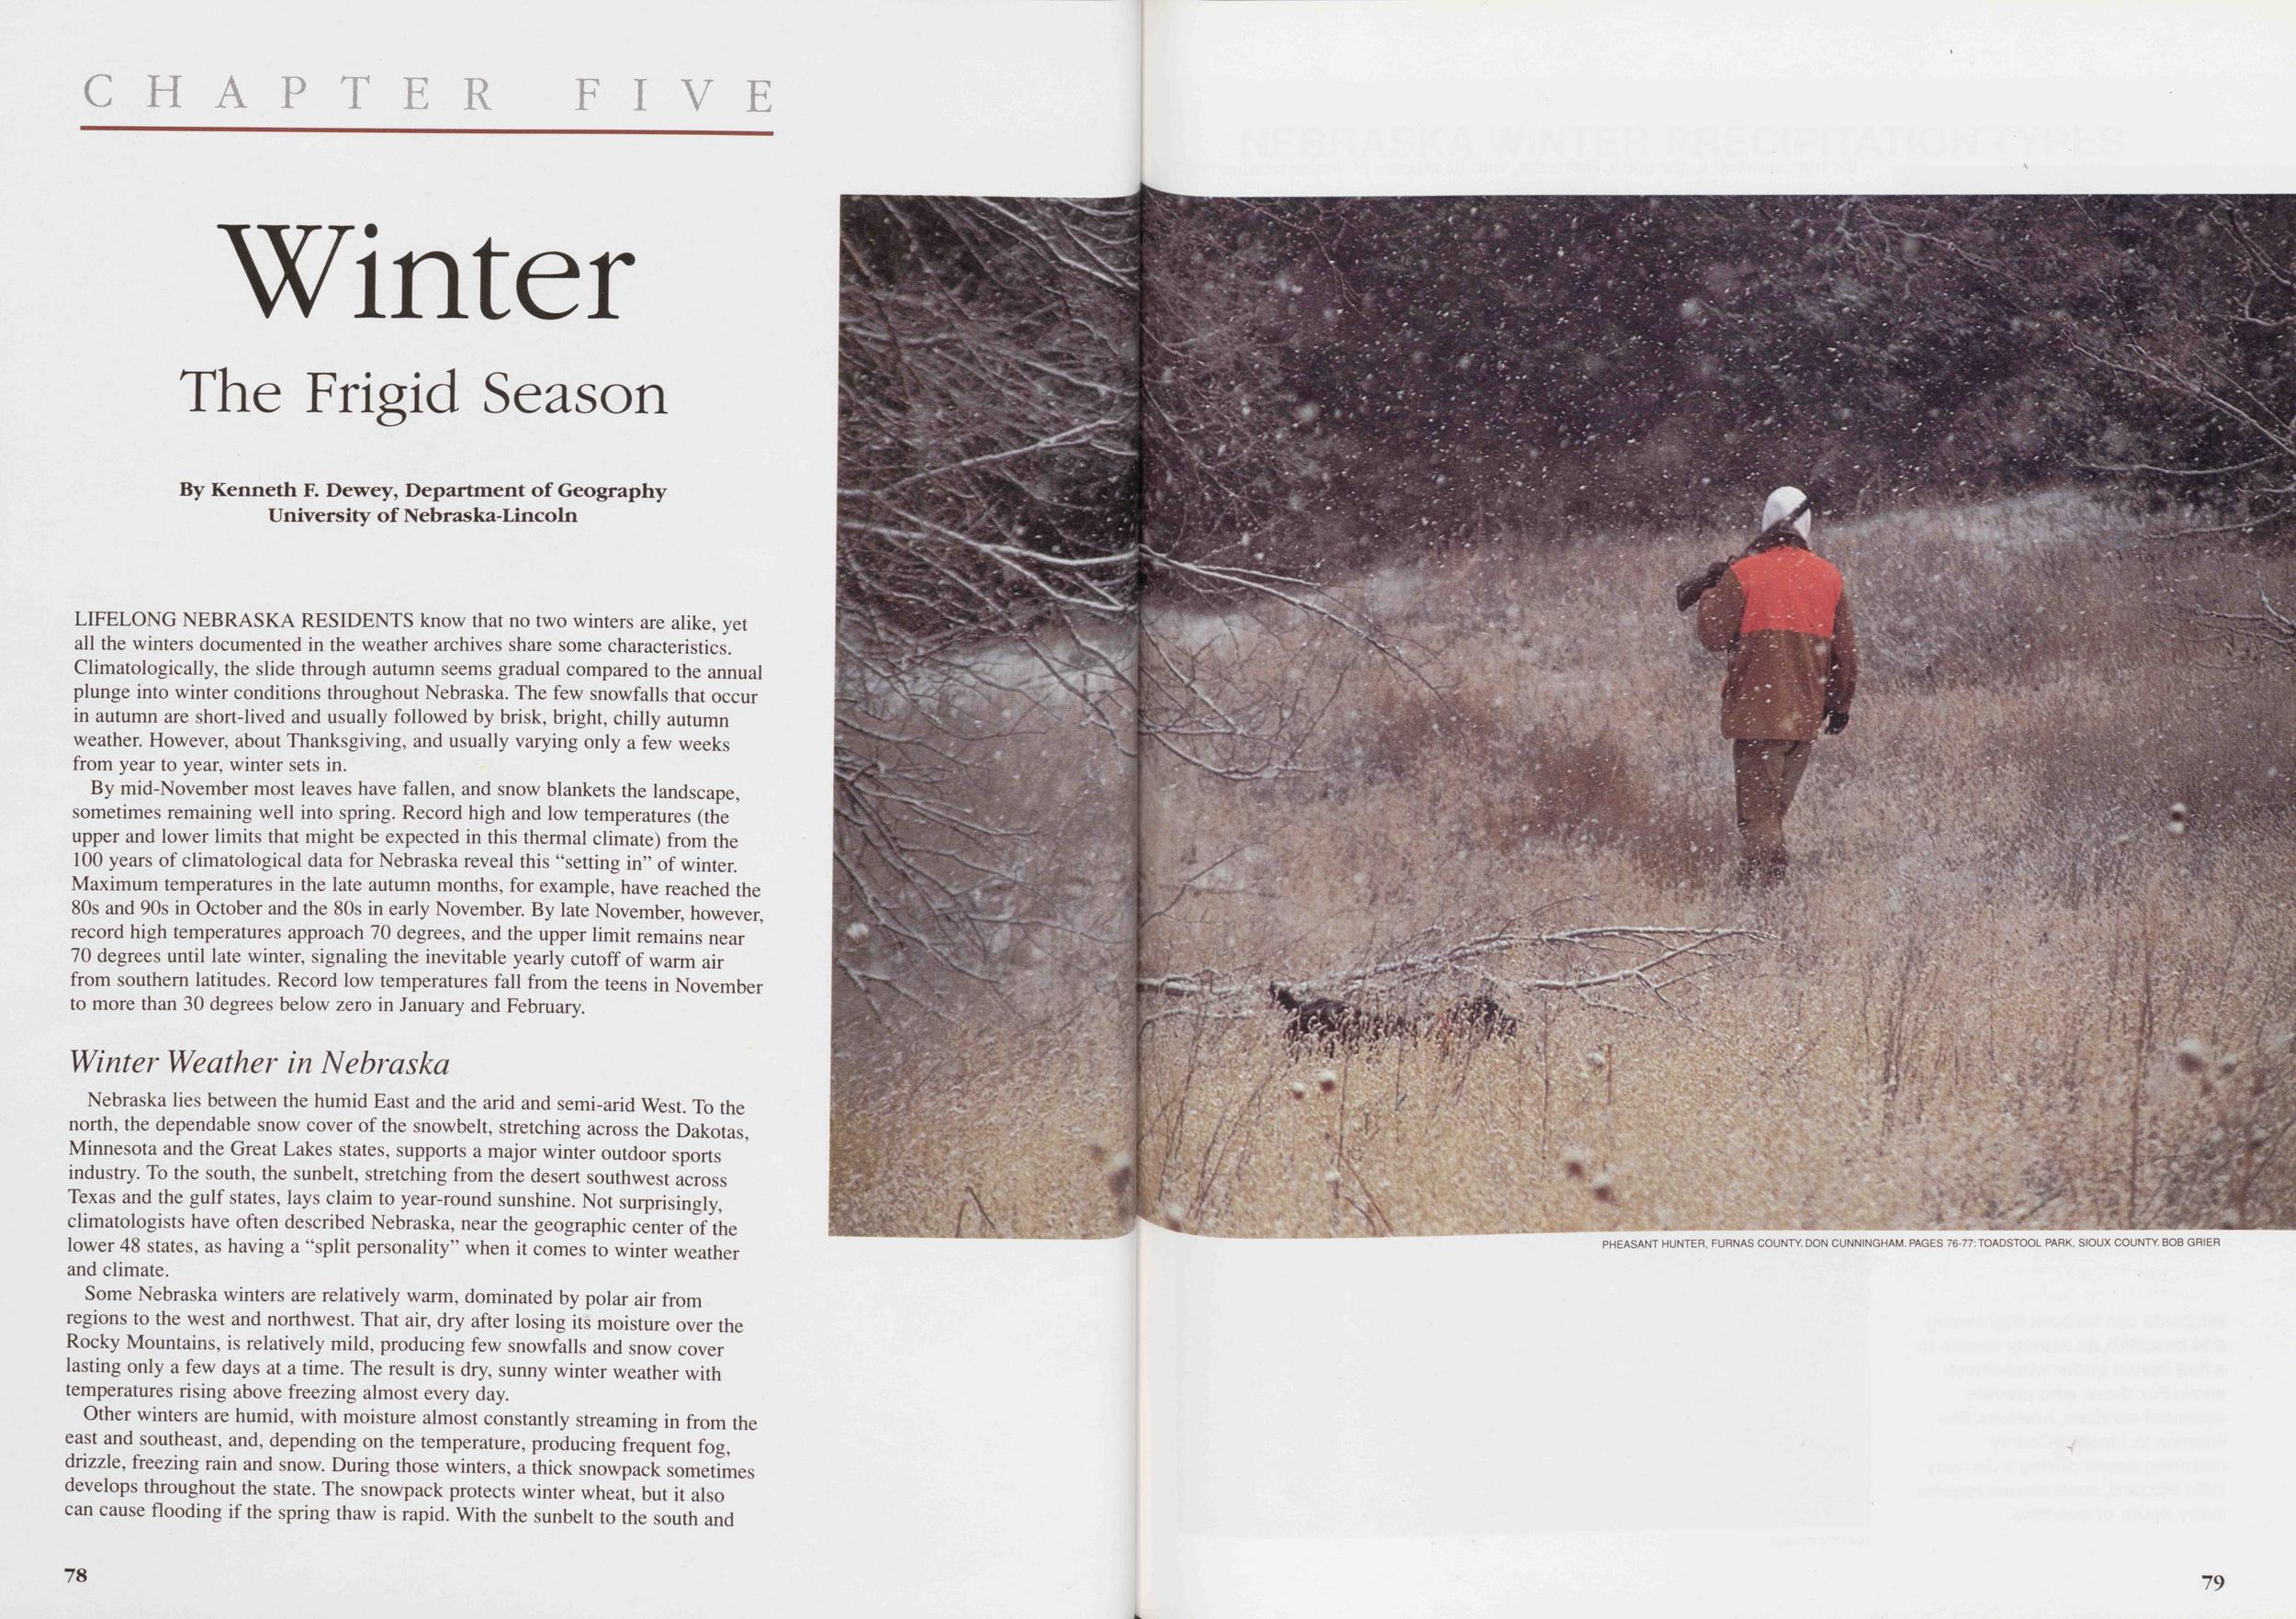
The Frigid Season
By Kenneth F. Dewey, Department of Geography University of Nebraska-LincolnLIFELONG NEBRASKA RESIDENTS know that no two winters are alike, yet all the winters documented in the weather archives share some characteristics. Climatologically, the slide through autumn seems gradual compared to the annual plunge into winter conditions throughout Nebraska. The few snowfalls that occur in autumn are short-lived and usually followed by brisk, bright, chilly autumn weather. However, about Thanksgiving, and usually varying only a few weeks from year to year, winter sets in.
By mid-November most leaves have fallen, and snow blankets the landscape, sometimes remaining well into spring. Record high and low temperatures (the upper and lower limits that might be expected in this thermal climate) from the 100 years of climatological data for Nebraska reveal this "setting in" of winter. Maximum temperatures in the late autumn months, for example, have reached the 80s and 90s in October and the 80s in early November. By late November, however, record high temperatures approach 70 degrees, and the upper limit remains near 70 degrees until late winter, signaling the inevitable yearly cutoff of warm air from southern latitudes. Record low temperatures fall from the teens in November to more than 30 degrees below zero in January and February.
Winter Weather in NebraskaNebraska lies between the humid East and the arid and semi-arid West. To the north, the dependable snow cover of the snowbelt, stretching across the Dakotas, Minnesota and the Great Lakes states, supports a major winter outdoor sports industry. To the south, the sunbelt, stretching from the desert southwest across Texas and the gulf states, lays claim to year-round sunshine. Not surprisingly, climatologists have often described Nebraska, near the geographic center of the lower 48 states, as having a "split personality" when it comes to winter weather and climate.
Some Nebraska winters are relatively warm, dominated by polar air from regions to the west and northwest. That air, dry after losing its moisture over the Rocky Mountains, is relatively mild, producing few snowfalls and snow cover lasting only a few days at a time. The result is dry, sunny winter weather with temperatures rising above freezing almost every day.
Other winters are humid, with moisture almost constantly streaming in from the east and southeast, and, depending on the temperature, producing frequent fog, drizzle, freezing rain and snow. During those winters, a thick snowpack sometimes develops throughout the state. The snowpack protects winter wheat, but it also can cause flooding if the spring thaw is rapid. With the sunbelt to the south and 78
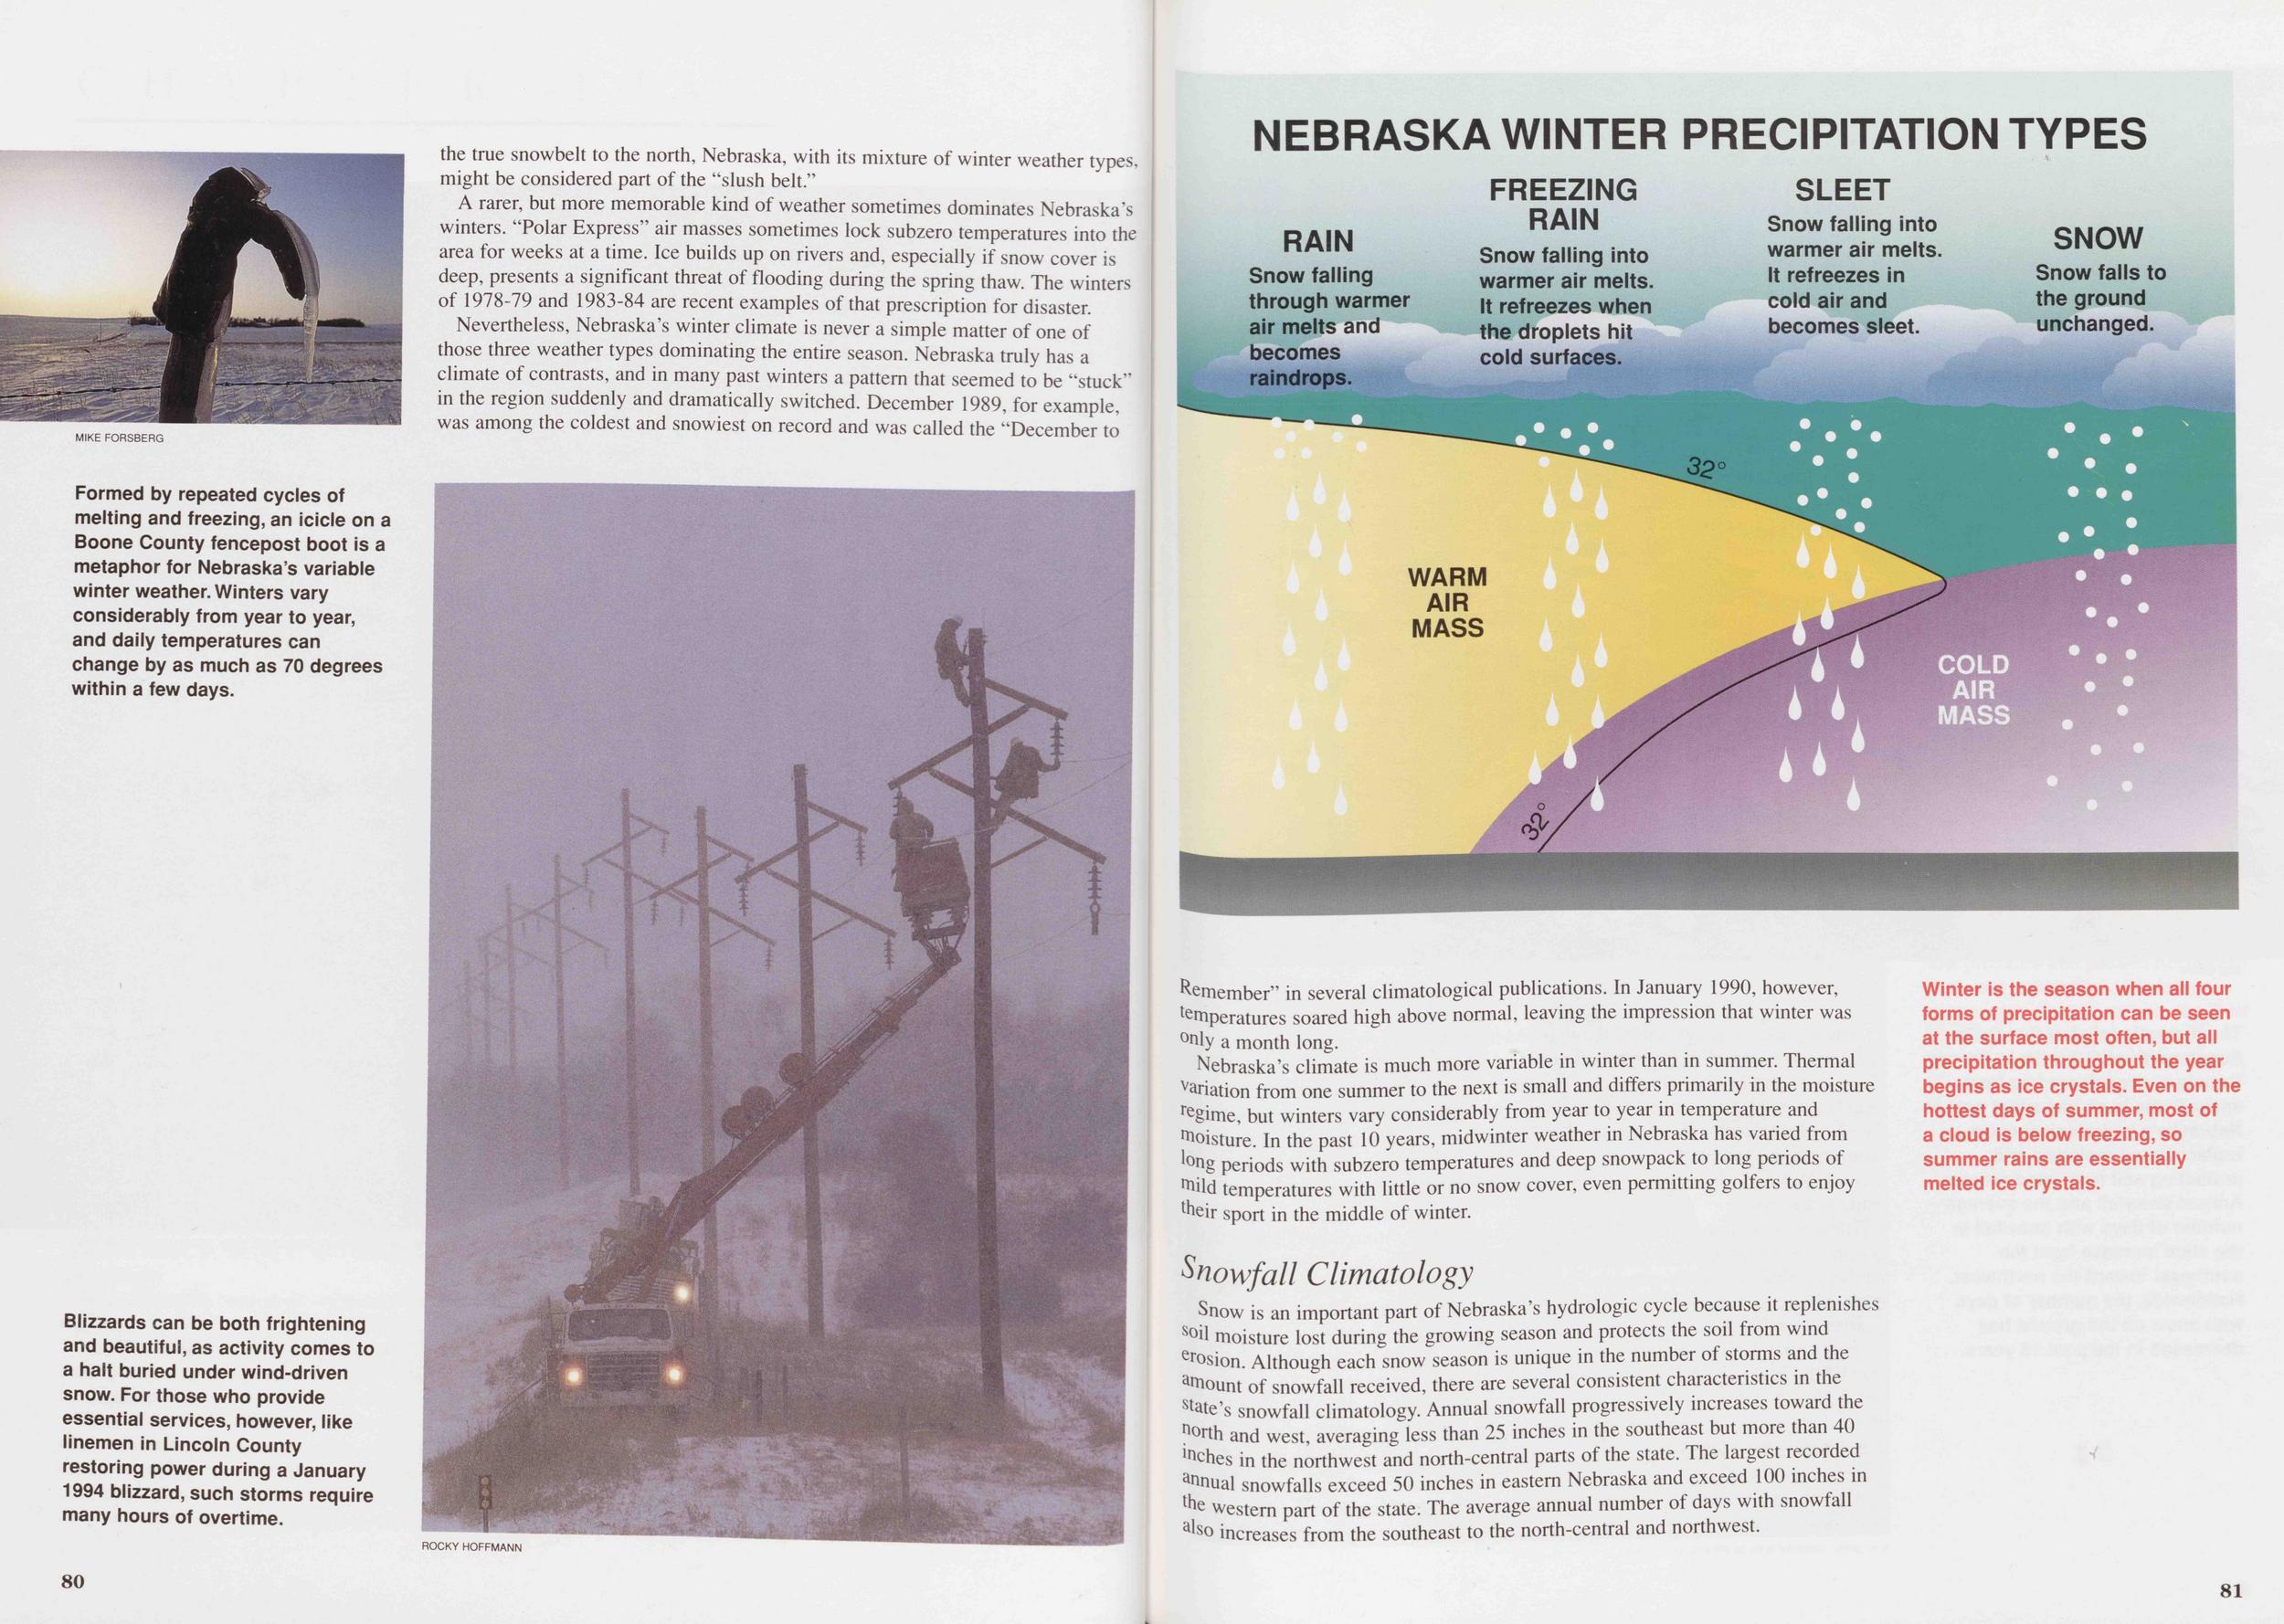
A rarer, but more memorable kind of weather sometimes dominates Nebraska's winters. "Polar Express" air masses sometimes lock subzero temperatures into the area for weeks at a time. Ice builds up on rivers and, especially if snow cover is deep, presents a significant threat of flooding during the spring thaw. The winters of 1978-79 and 1983-84 are recent examples of that prescription for disaster.
Nevertheless, Nebraska's winter climate is never a simple matter of one of those three weather types dominating the entire season. Nebraska truly has a climate of contrasts, and in many past winters a pattern that seemed to be "stuck" in the region suddenly and dramatically switched. December 1989, for example, was among the coldest and snowiest on record and was called the "December to
Nebraska's climate is much more variable in winter than in summer. Thermal variation from one summer to the next is small and differs primarily in the moisture tegime, but winters vary considerably from year to year in temperature and Moisture. In the past 10 years, midwinter weather in Nebraska has varied from long periods with subzero temperatures and deep snowpack to long periods of teild temperatures with little or no snow cover, even permitting golfers to enjoy lheir sport in the middle of winter.
Snowfall ClimatologySnow is an important part of Nebraska's hydrologic cycle because it replenishes soil moisture lost during the growing season and protects the soil from wind erosion. Although each snow season is unique in the number of storms and the arnount of snowfall received, there are several consistent characteristics in the state's snowfall climatology. Annual snowfall progressively increases toward the n°rth and west, averaging less than 25 inches in the southeast but more than 40 inches in the northwest and north-central parts of the state. The largest recorded annual snowfalls exceed 50 inches in eastern Nebraska and exceed 100 inches in the western part of the state. The average annual number of days with snowfall also increases from the southeast to the north-central and northwest.
81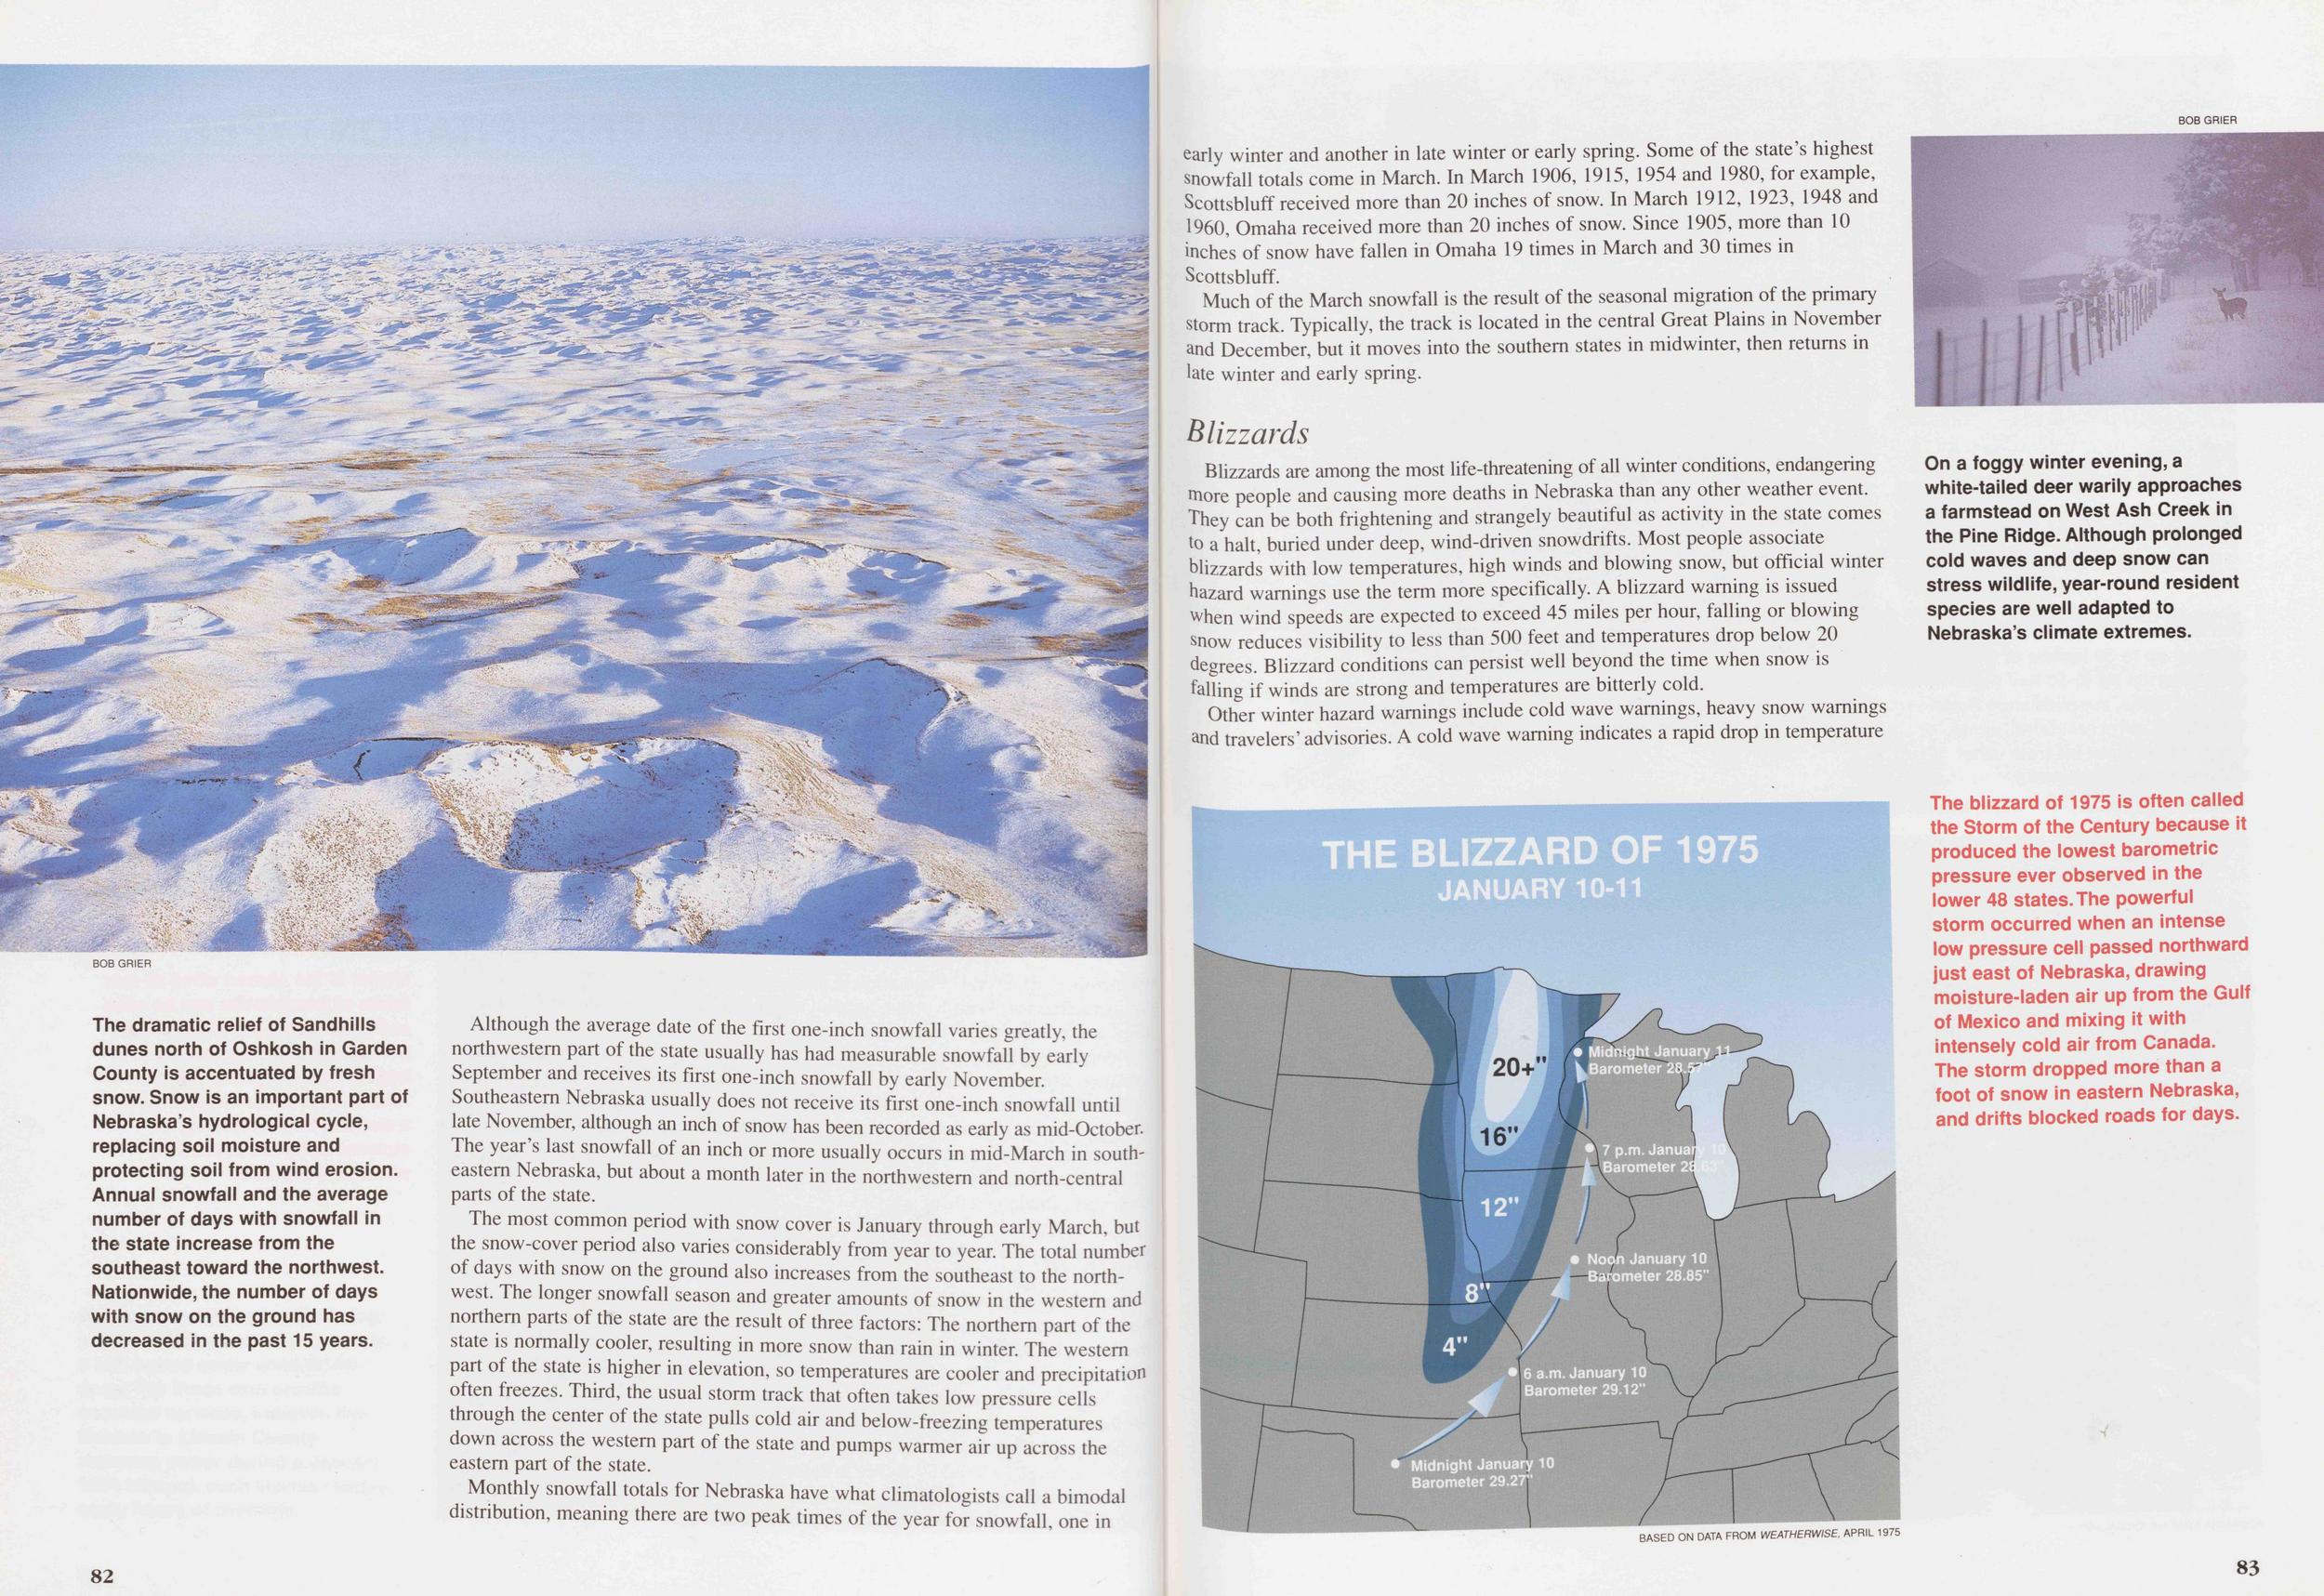
Although the average date of the first one-inch snowfall varies greatly, the northwestern part of the state usually has had measurable snowfall by early September and receives its first one-inch snowfall by early November. Southeastern Nebraska usually does not receive its first one-inch snowfall until late November, although an inch of snow has been recorded as early as mid-October. The year's last snowfall of an inch or more usually occurs in mid-March in southeastern Nebraska, but about a month later in the northwestern and north-central parts of the state.
The most common period with snow cover is January through early March, but the snow-cover period also varies considerably from year to year. The total number of days with snow on the ground also increases from the southeast to the northwest. The longer snowfall season and greater amounts of snow in the western and northern parts of the state are the result of three factors: The northern part of the state is normally cooler, resulting in more snow than rain in winter. The western part of the state is higher in elevation, so temperatures are cooler and precipitation often freezes. Third, the usual storm track that often takes low pressure cells through the center of the state pulls cold air and below-freezing temperatures down across the western part of the state and pumps warmer air up across the eastern part of the state.
Monthly snowfall totals for Nebraska have what climatologists call a bimodal distribution, meaning there are two peak times of the year for snowfall, one in 82 early winter and another in late winter or early spring. Some of the state's highest snowfall totals come in March. In March 1906, 1915, 1954 and 1980, for example, Scottsbluff received more than 20 inches of snow. In March 1912, 1923, 1948 and I960, Omaha received more than 20 inches of snow. Since 1905, more than 10 inches of snow have fallen in Omaha 19 times in March and 30 times in Scottsbluff.
Much of the March snowfall is the result of the seasonal migration of the primary storm track. Typically, the track is located in the central Great Plains in November and December, but it moves into the southern states in midwinter, then returns in late winter and early spring.
BlizzardsBlizzards are among the most life-threatening of all winter conditions, endangering more people and causing more deaths in Nebraska than any other weather event. They can be both frightening and strangely beautiful as activity in the state comes to a halt, buried under deep, wind-driven snowdrifts. Most people associate blizzards with low temperatures, high winds and blowing snow, but official winter hazard warnings use the term more specifically. A blizzard warning is issued when wind speeds are expected to exceed 45 miles per hour, falling or blowing snow reduces visibility to less than 500 feet and temperatures drop below 20 degrees. Blizzard conditions can persist well beyond the time when snow is falling if winds are strong and temperatures are bitterly cold.
Other winter hazard warnings include cold wave warnings, heavy snow warnings and travelers' advisories. A cold wave warning indicates a rapid drop in temperature
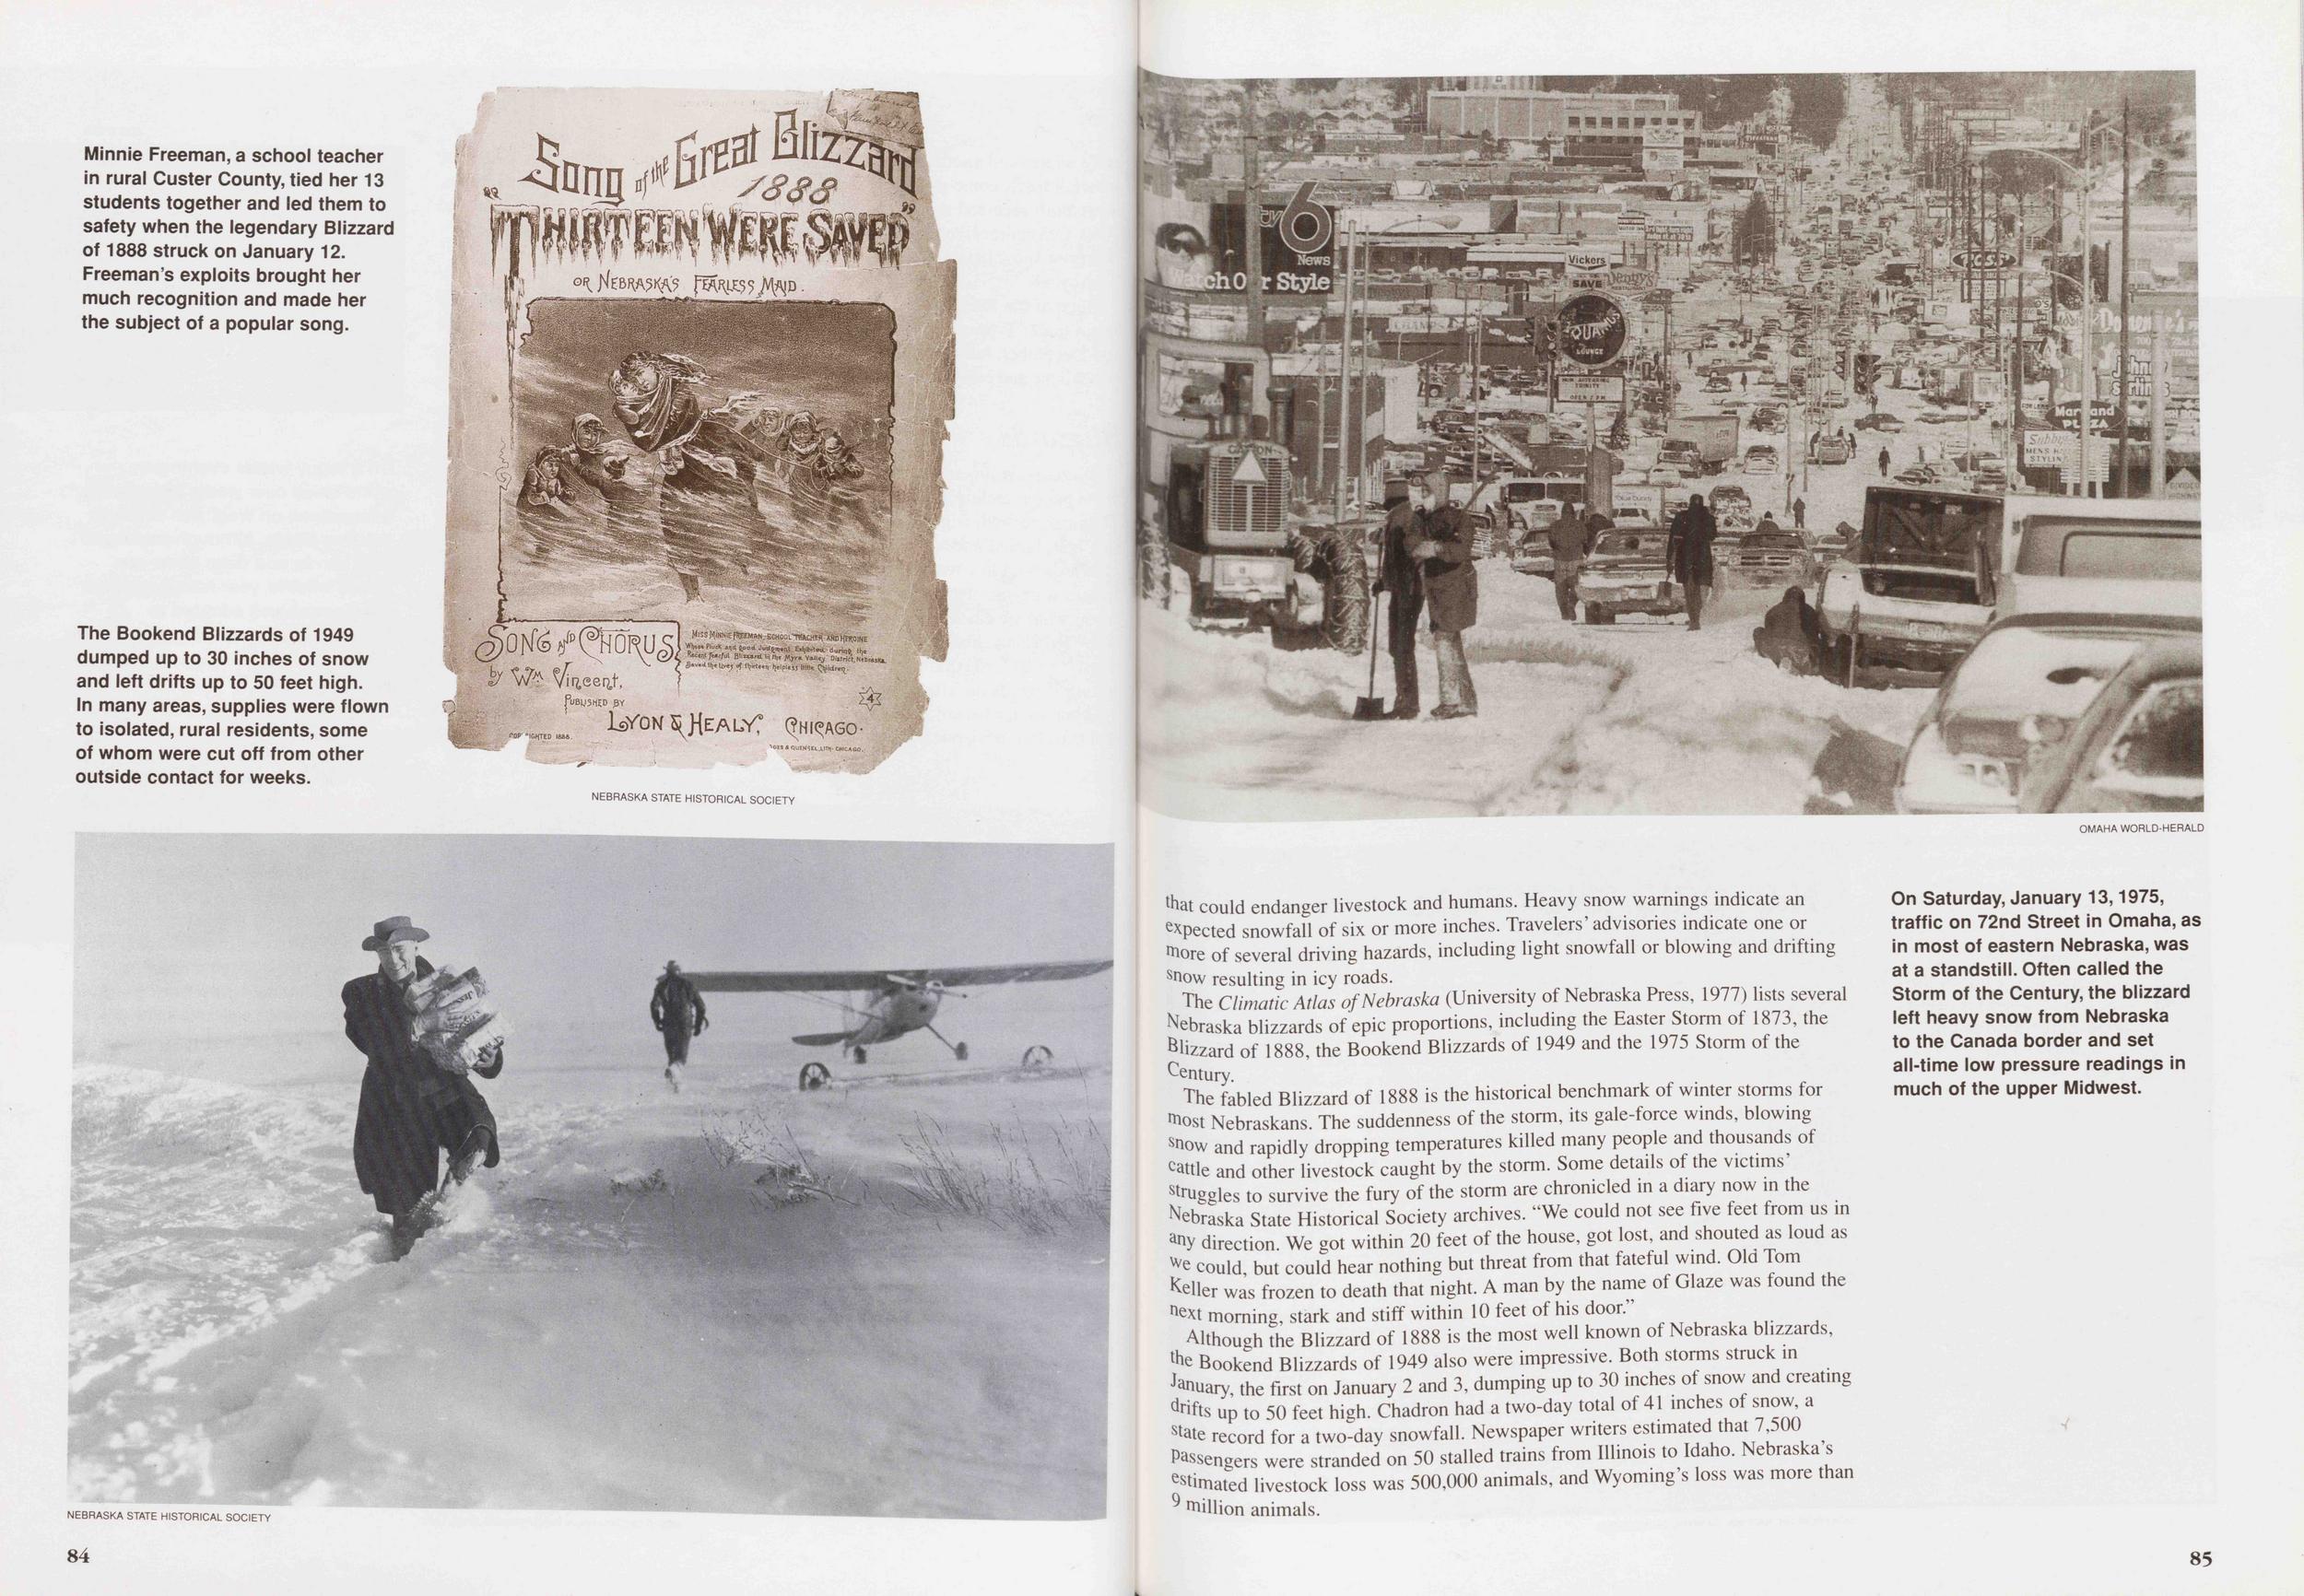
The Climatic Atlas of Nebraska (University of Nebraska Press, 1977) lists several Nebraska blizzards of epic proportions, including the Easter Storm of 1873, the Gizzard of 1888, the Bookend Blizzards of 1949 and the 1975 Storm of the Century.
The fabled Blizzard of 1888 is the historical benchmark of winter storms for "lost Nebraskans The suddenness of the storm, its gale-force winds, blowing snow and rapidly dropping temperatures killed many people and thousands of cattle and other livestock caught by the storm. Some details of the victims' druggies to survive the fury of the storm are chronicled in a diary now in the Nebraska State Historical Society archives. "We could not see five feet from us in a"V direction We got within 20 feet of the house, got lost, and shouted as loud as *e could, but could hear nothing but threat from that fateful wind. Ola Tom teller was frozen to death that night. A man by the name of Glaze was found the "ext morning, stark and stiff within 10 feet of his door."
Although the Blizzard of 1888 is the most well known of Nebraska blizzards, l"e Bookend Blizzards of 1949 also were impressive. Both storms struck in Jauary the first on January 2 and 3, dumping up to 30 inches of snow and creating "rifts up to 50 feet high. Chadron had a two-day total of 41 inches of snow a record for a two-day snowfall. Newspaper writers estimated that 7 500 Passengers were stranded on 50 stalled trains from Illinois to Idaho. Nebraska estimated livestock loss was 500,000 animals, and Wyoming's loss was more than y million animals.
85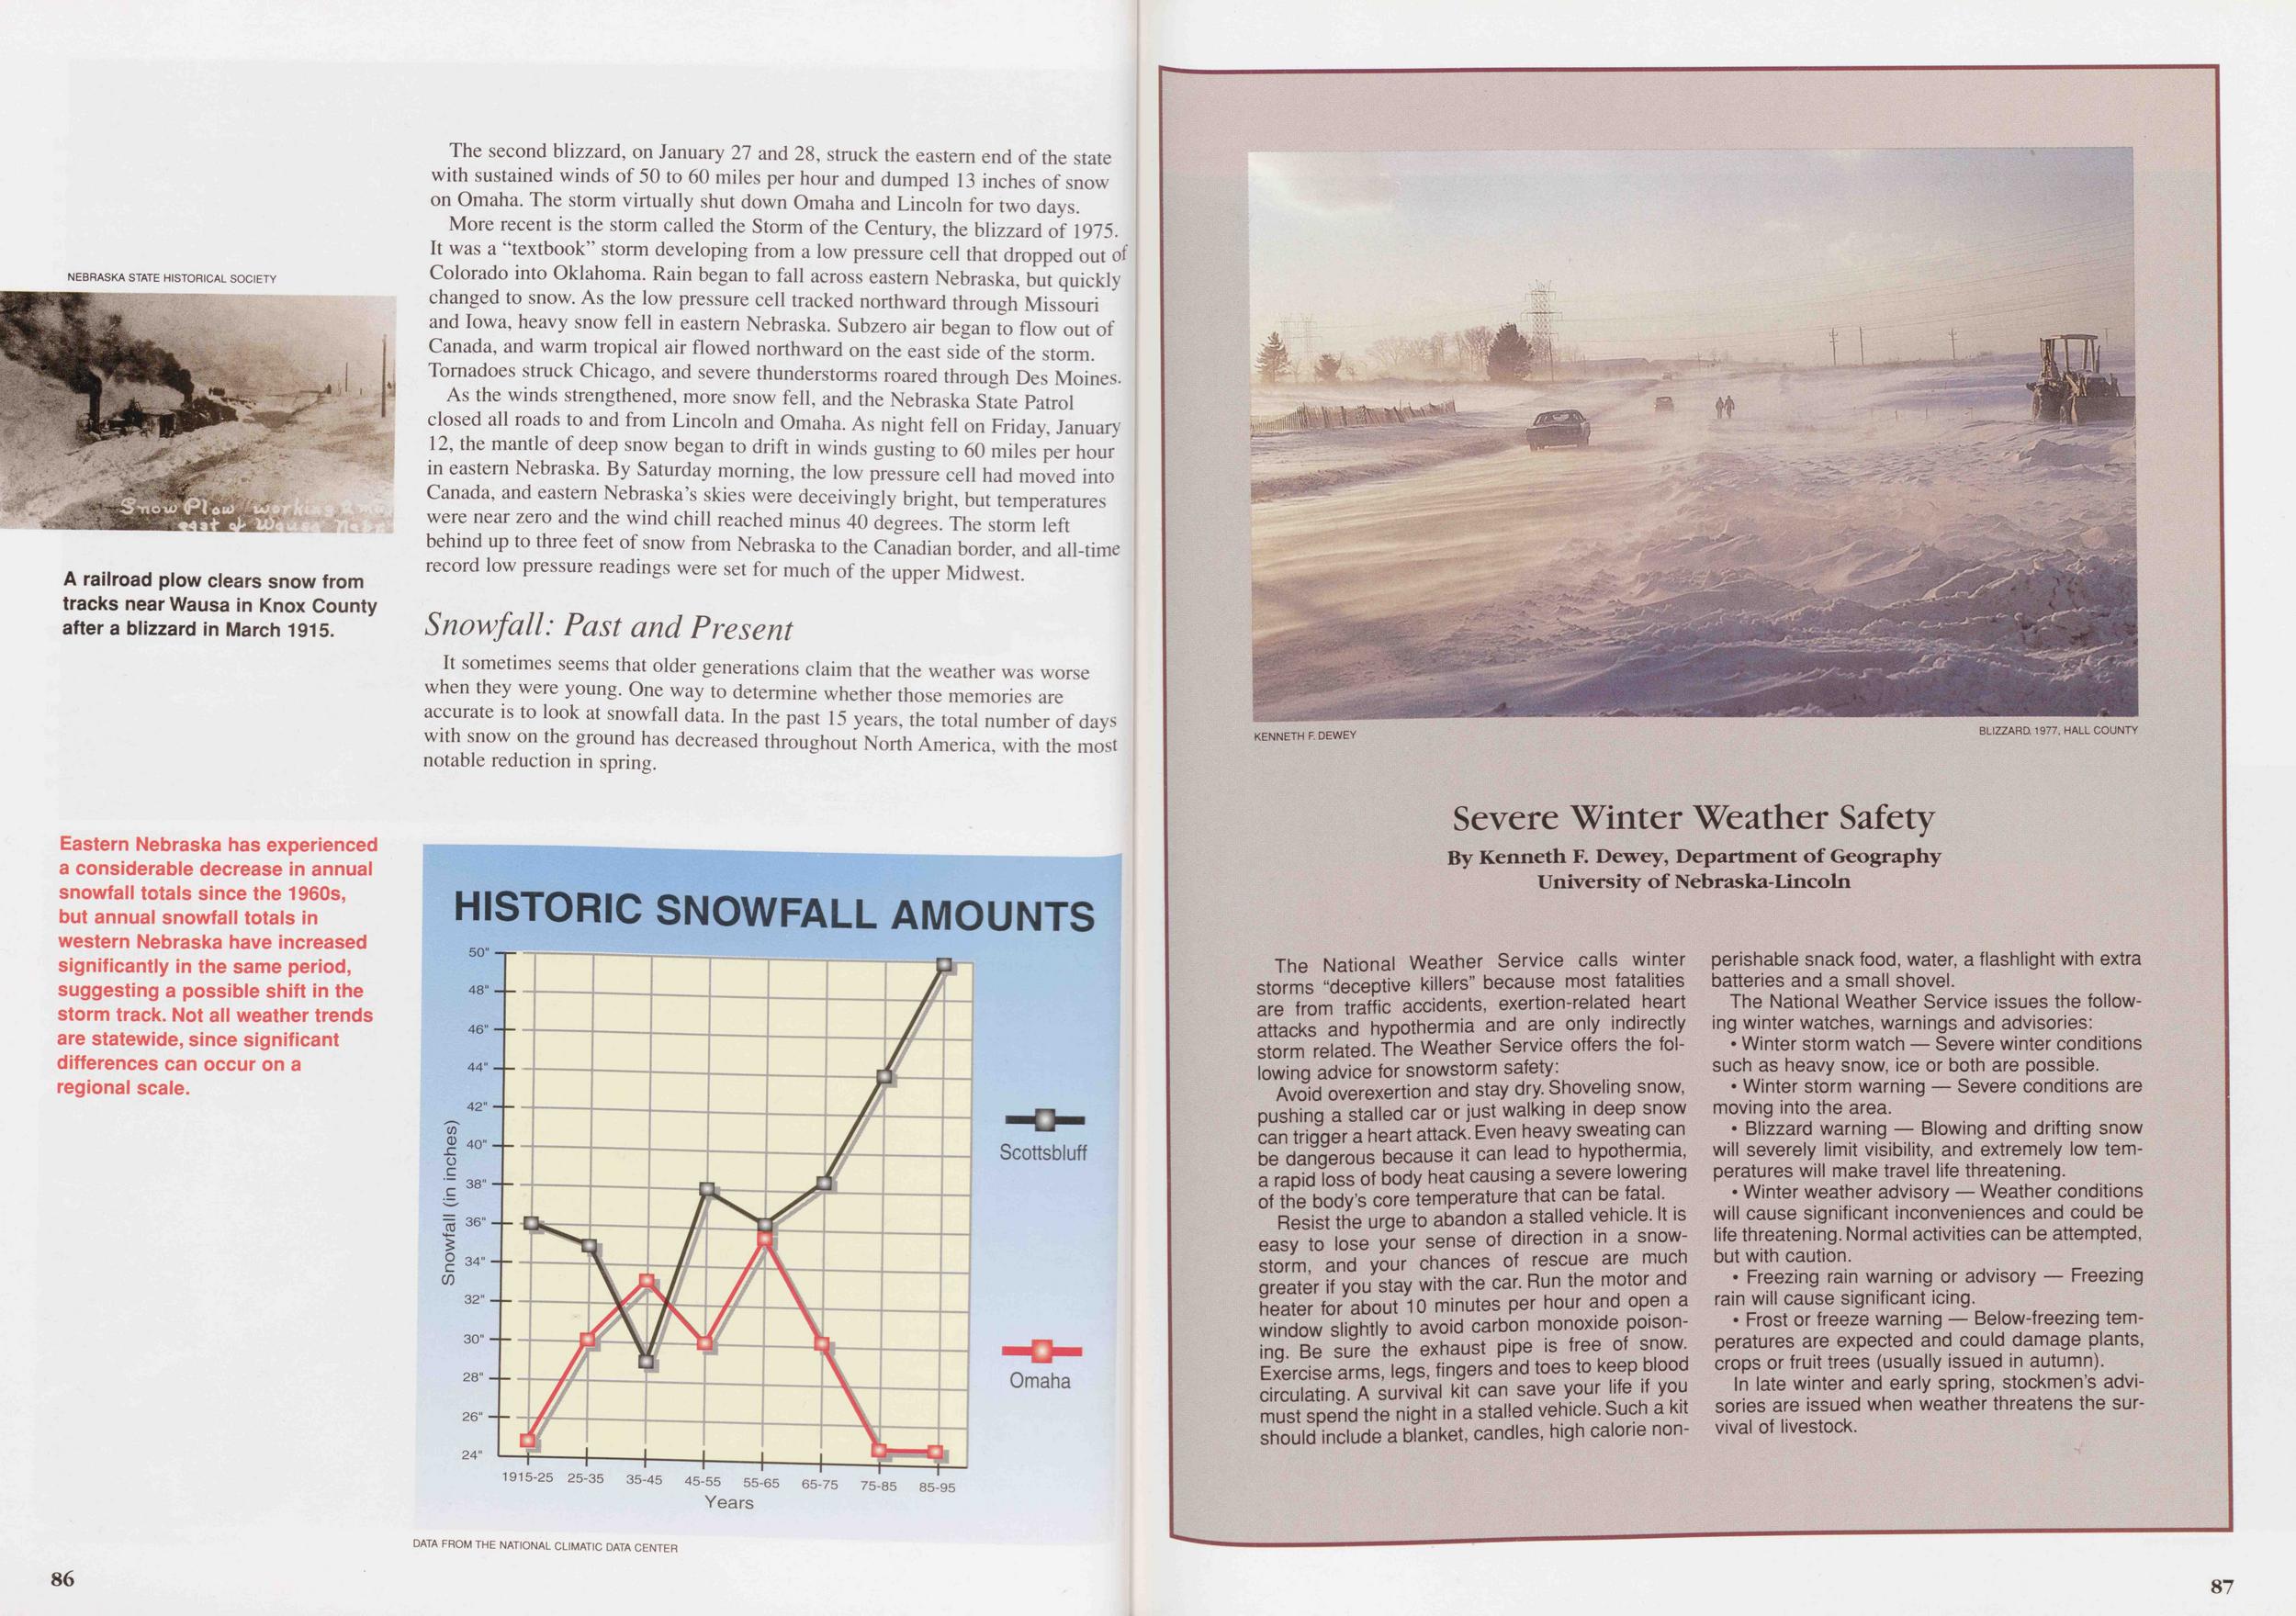
The second blizzard, on January 27 and 28, struck the eastern end of the state with sustained winds of 50 to 60 miles per hour and dumped 13 inches of snow on Omaha. The storm virtually shut down Omaha and Lincoln for two days.
More recent is the storm called the Storm of the Century, the blizzard of 1975. It was a "textbook" storm developing from a low pressure cell that dropped out of Colorado into Oklahoma. Rain began to fall across eastern Nebraska, but quickly changed to snow. As the low pressure cell tracked northward through Missouri and Iowa, heavy snow fell in eastern Nebraska. Subzero air began to flow out of Canada, and warm tropical air flowed northward on the east side of the storm. Tornadoes struck Chicago, and severe thunderstorms roared through Des Moines.
As the winds strengthened, more snow fell, and the Nebraska State Patrol closed all roads to and from Lincoln and Omaha. As night fell on Friday, January 12, the mantle of deep snow began to drift in winds gusting to 60 miles per hour in eastern Nebraska. By Saturday morning, the low pressure cell had moved into Canada, and eastern Nebraska's skies were deceivingly bright, but temperatures were near zero and the wind chill reached minus 40 degrees. The storm left behind up to three feet of snow from Nebraska to the Canadian border, and all-time record low pressure readings were set for much of the upper Midwest.
Snowfall: Past and PresentIt sometimes seems that older generations claim that the weather was worse when they were young. One way to determine whether those memories are accurate is to look at snowfall data. In the past 15 years, the total number of days with snow on the ground has decreased throughout North America, with the most notable reduction in spring.
The National Weather Service calls winter storms "deceptive killers" because most fatalities are from traffic accidents, exertion-related heart attacks and hypothermia and are only indirectly storm related. The Weather Service offers the following advice for snowstorm safety:
Avoid overexertion and stay dry. Shoveling snow, pushing a stalled car or just walking in deep snow can trigger a heart attack. Even heavy sweating can be dangerous because it can lead to hypothermia, a rapid loss of body heat causing a severe lowering of the body's core temperature that can be fatal.
Resist the urge to abandon a stalled vehicle. It is easy to lose your sense of direction in a snowstorm and your chances of rescue are much greater if you stay with the car. Run the motor and heater for about 10 minutes per hour and open a window slightly to avoid carbon monoxide poisoning. Be sure the exhaust pipe is free of snow Exercise arms, legs, fingers and toes to keep blood circulating. A survival kit can save your life if you must spend the night in a stalled vehicle. Such a kit should include a blanket, candles, high calorie nonperishable snack food, water, a flashlight with extra batteries and a small shovel.
The National Weather Service issues the following winter watches, warnings and advisories:
• Winter storm watch — Severe winter conditions such as heavy snow, ice or both are possible.
• Winter storm warning — Severe conditions are moving into the area.
• Blizzard warning — Blowing and drifting snow will severely limit visibility, and extremely low temperatures will make travel life threatening.
• Winter weather advisory — Weather conditions will cause significant inconveniences and could be life threatening. Normal activities can be attempted, but with caution.
• Freezing rain warning or advisory — Freezing rain will cause significant icing.
• Frost or freeze warning — Below-freezing temperatures are expected and could damage plants, crops or fruit trees (usually issued in autumn).
In late winter and early spring, stockmen's advisories are issued when weather threatens the survival of livestock.
87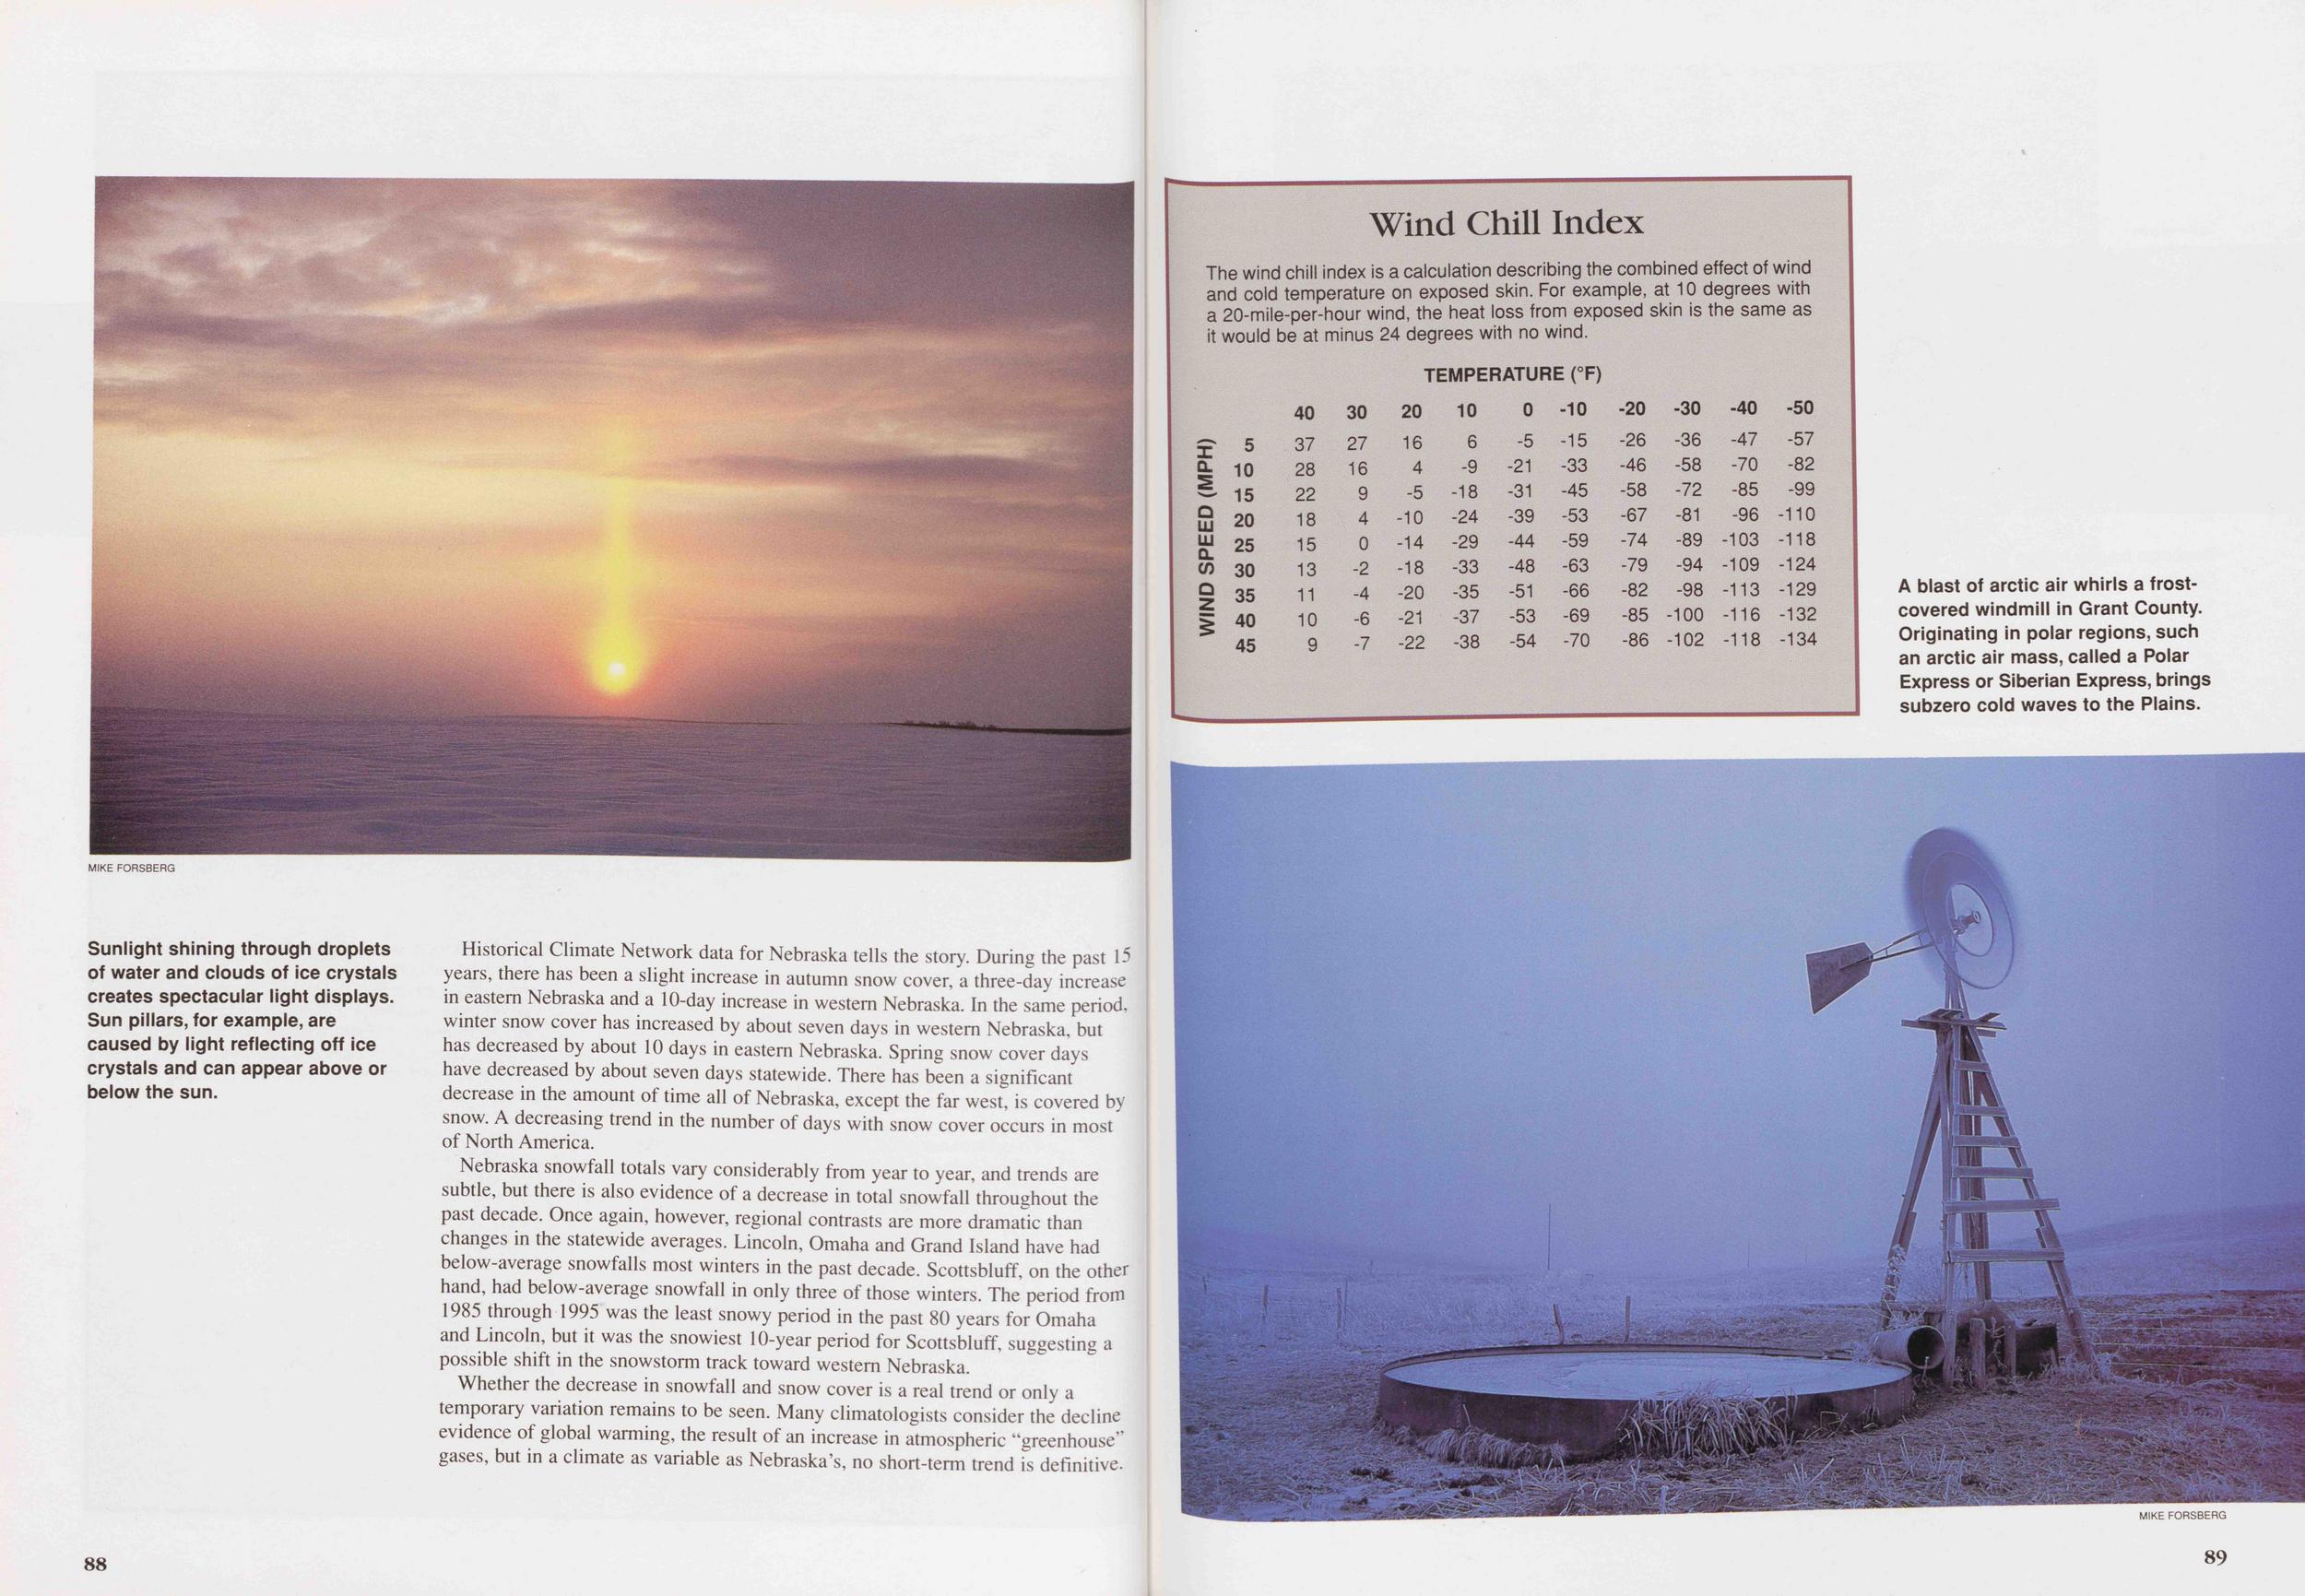
Historical Climate Network data for Nebraska tells the story. During the past 15 years, there has been a slight increase in autumn snow cover, a three-day increase in eastern Nebraska and a 10-day increase in western Nebraska. In the same period, winter snow cover has increased by about seven days in western Nebraska, but has decreased by about 10 days in eastern Nebraska. Spring snow cover days have decreased by about seven days statewide. There has been a significant decrease in the amount of time all of Nebraska, except the far west, is covered by snow. A decreasing trend in the number of days with snow cover occurs in most of North America.
Nebraska snowfall totals vary considerably from year to year, and trends are subtle, but there is also evidence of a decrease in total snowfall throughout the past decade. Once again, however, regional contrasts are more dramatic than changes in the statewide averages. Lincoln, Omaha and Grand Island have had below-average snowfalls most winters in the past decade. Scottsbluff, on the other hand, had below-average snowfall in only three of those winters. The period from 1985 through 1995 was the least snowy period in the past 80 years for Omaha and Lincoln, but it was the snowiest 10-year period for Scottsbluff, suggesting a possible shift in the snowstorm track toward western Nebraska.
Whether the decrease in snowfall and snow cover is a real trend or only a temporary variation remains to be seen. Many climatologists consider the decline evidence of global warming, the result of an increase in atmospheric "greenhouse" gases, but in a climate as variable as Nebraska's, no short-term trend is definitive.
88 Wind Chill IndexThe wind chill index is a calculation describing the combined effect of wind and cold temperature on exposed skin. For example, at 10 degrees with a 20-mile-per-hour wind, the heat loss from exposed skin is the same as it would be at minus 24 degrees with no wind.
X QL Q LU UJ Q. CO O 5 10 15 20 25 30 35 40 45 40 37 28 22 18 15 13 11 10 9 30 27 16 9 4 0 -2 -4 -6 -7 TEMPERATURE (°F) 20 10 0 -10 16 4 -5 -10 -14 -18 -20 -21 -22 6 -9 -18 -24 -29 -33 -35 -37 -38 -5 -21 -31 -39 -44 -48 -51 -53 -54 -15 -33 -45 -53 -59 -63 -66 -69 -70 -20 -26 -46 -58 -67 -74 -79 -82 -85 -86 -30 -36 -58 -72 -81 -89 -94 -98 -100 -102 -40 -47 -70 -85 -96 103 109 113 116 118 -50 -57 -82 -99 -110 -118 -124 -129 -132 -134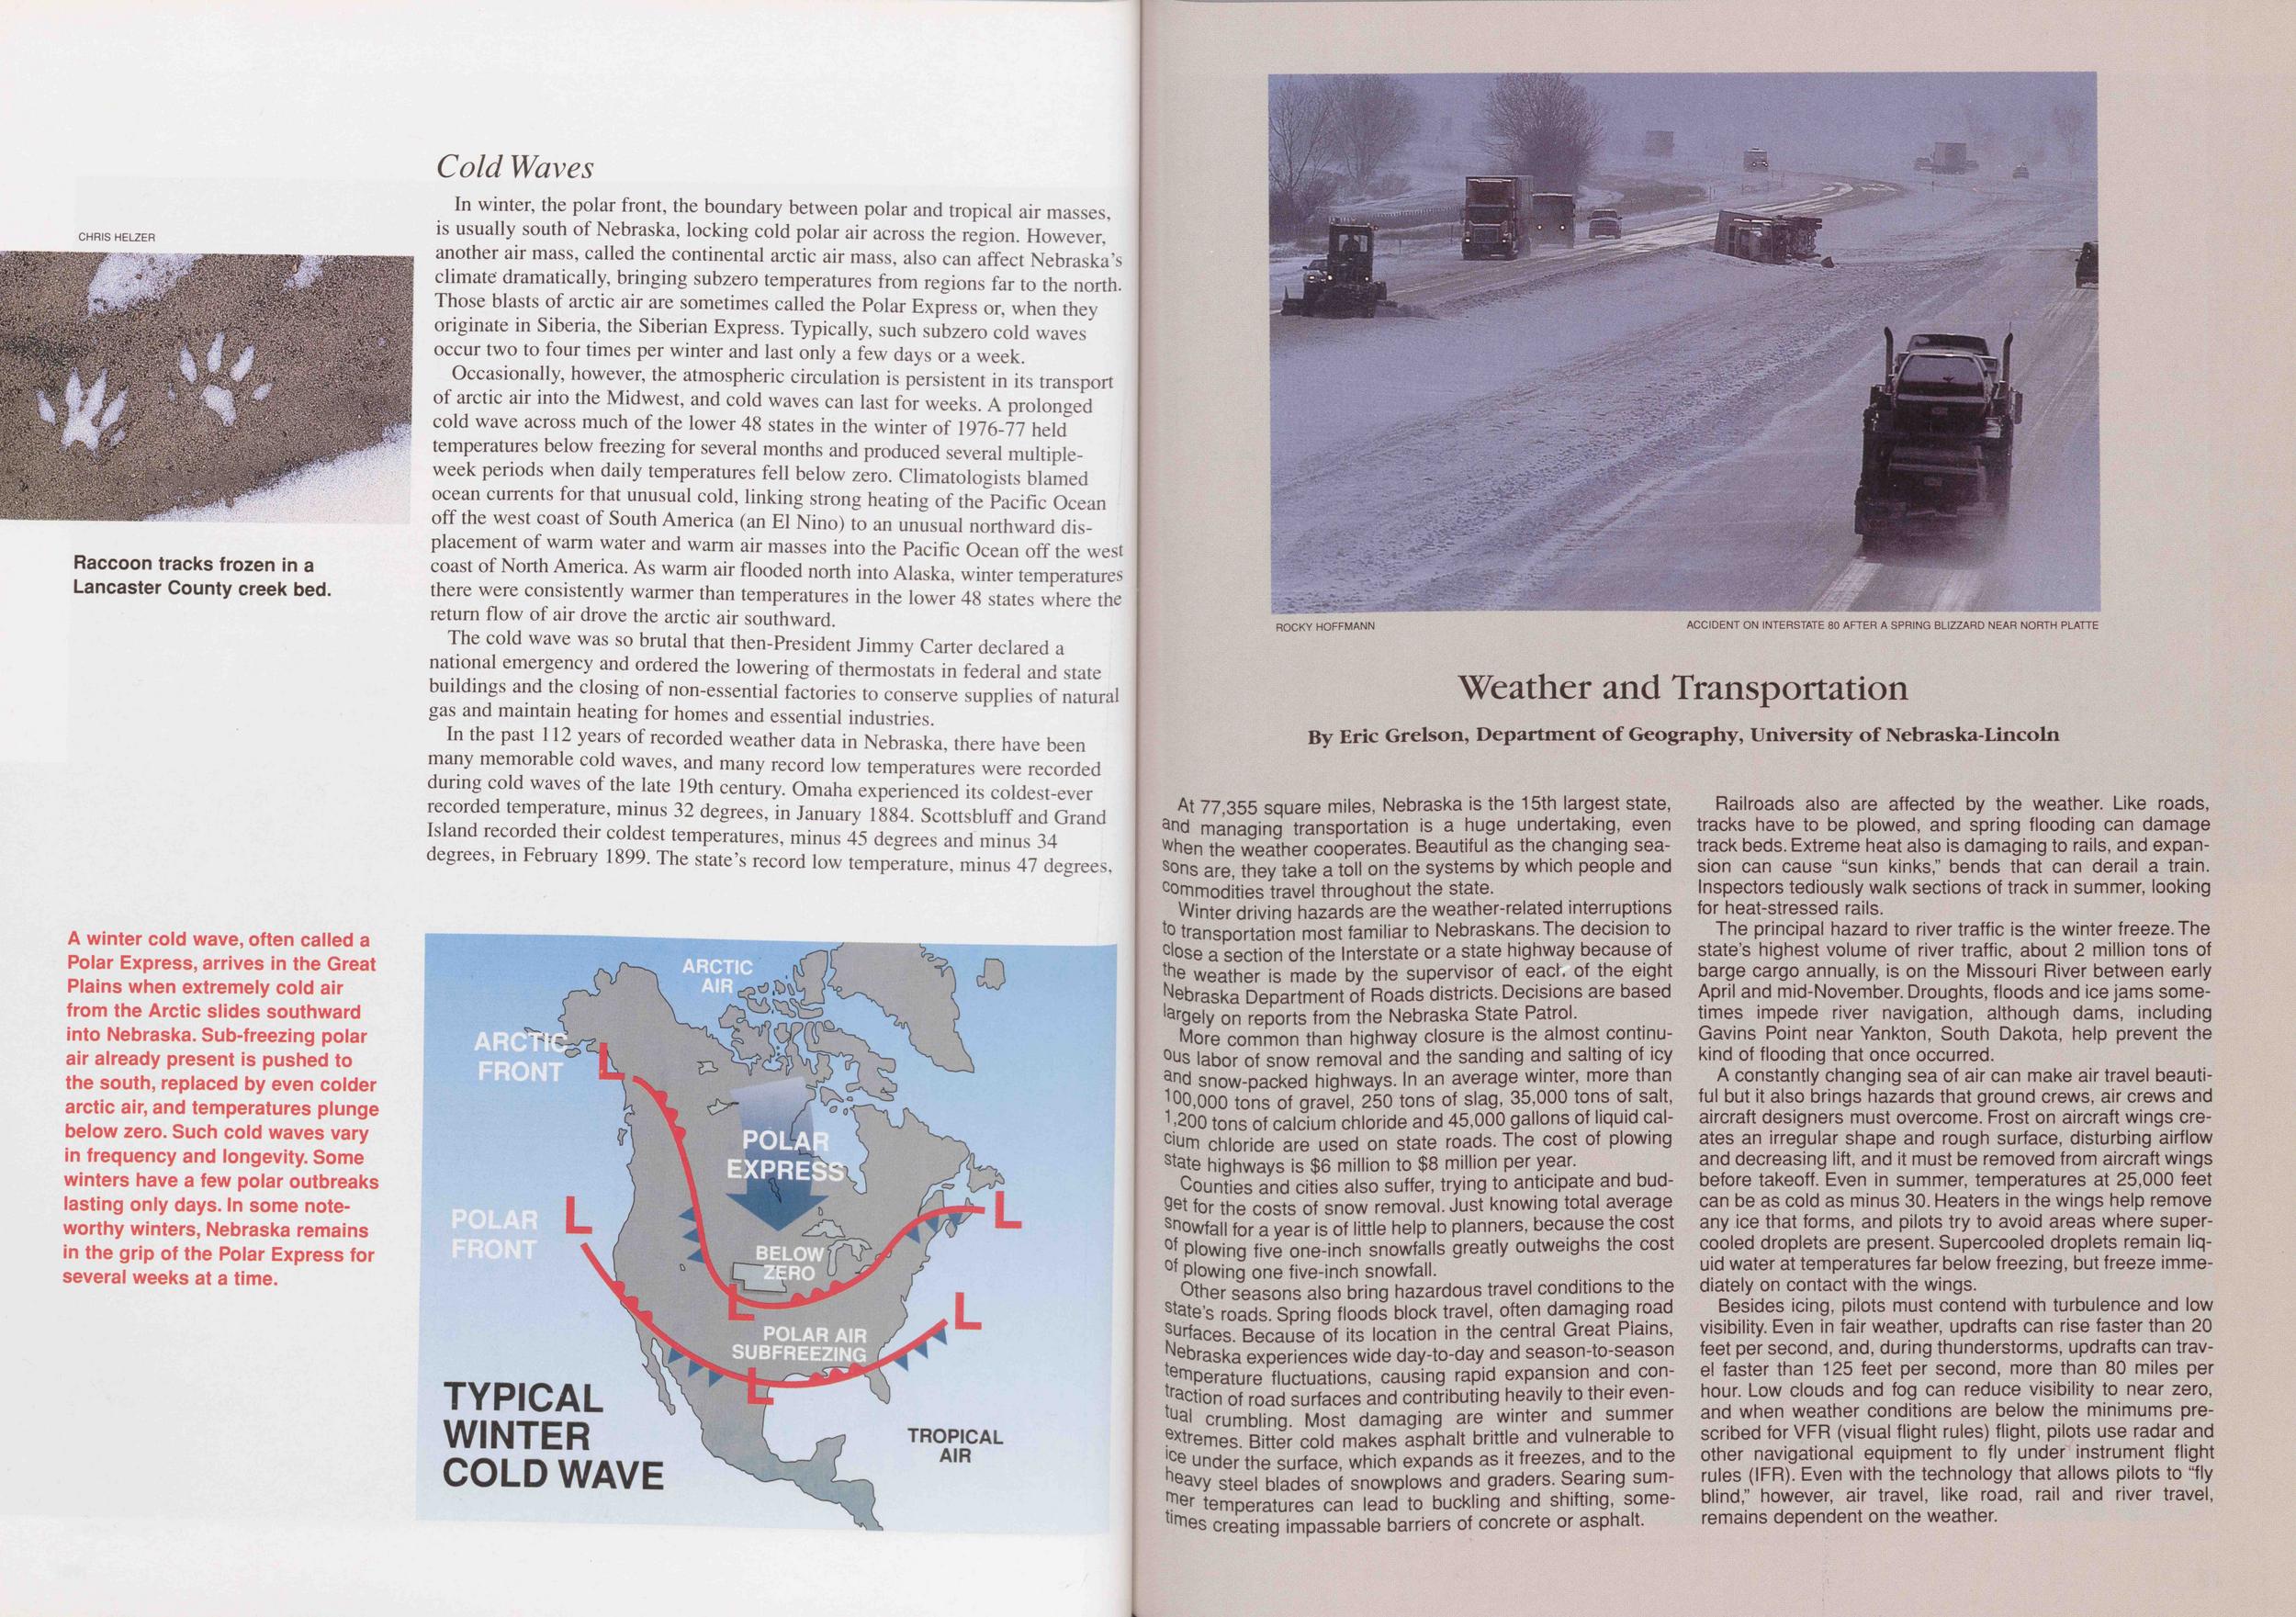
In winter, the polar front, the boundary between polar and tropical air masses, is usually south of Nebraska, locking cold polar air across the region. However, another air mass, called the continental arctic air mass, also can affect Nebraska's climate dramatically, bringing subzero temperatures from regions far to the north. Those blasts of arctic air are sometimes called the Polar Express or, when they originate in Siberia, the Siberian Express. Typically, such subzero cold waves occur two to four times per winter and last only a few days or a week.
Occasionally, however, the atmospheric circulation is persistent in its transport of arctic air into the Midwest, and cold waves can last for weeks. A prolonged cold wave across much of the lower 48 states in the winter of 1976-77 held temperatures below freezing for several months and produced several multiple week periods when daily temperatures fell below zero. Climatologists blamed ocean currents for that unusual cold, linking strong heating of the Pacific Ocean off the west coast of South America (an El Nino) to an unusual northward dis- placement of warm water and warm air masses into the Pacific Ocean off the west coast of North America. As warm air flooded north into Alaska, winter temperatures there were consistently warmer than temperatures in the lower 48 states where the return flow of air drove the arctic air southward.
The cold wave was so brutal that then-President Jimmy Carter declared a national emergency and ordered the lowering of thermostats in federal and state buildings and the closing of non-essential factories to conserve supplies of natural gas and maintain heating for homes and essential industries.
In the past 112 years of recorded weather data in Nebraska, there have been many memorable cold waves, and many record low temperatures were recorded during cold waves of the late 19th century. Omaha experienced its coldest-ever recorded temperature, minus 32 degrees, in January 1884. Scottsbluff and Grand Island recorded their coldest temperatures, minus 45 degrees and minus 34 degrees, in February 1899. The state's record low temperature, minus 47 degrees, was recorded on February 12, 1899, at Camp Clarke near Bridgeport. Oshkosh reached the same temperature on December 22, 1989.
At 77,355 square miles, Nebraska is the 15th largest state, and managing transportation is a huge undertaking, even when the weather cooperates. Beautiful as the changing sea- s°ns are, they take a toll on the systems by which people and commodities travel throughout the state.
Winter driving hazards are the weather-related interruptions to transportation most familiar to Nebraskans.The decision to close a section of the Interstate or a state highway because of the weather is made by the supervisor of each of the eight Nebraska Department of Roads districts. Decisions are based on reports from the Nebraska State Patrol.
More common than highway closure is the almost continues labor of snow removal and the sanding and salting of icy and snow-packed highways. In an average winter, more than 100,000 tons of gravel, 250 tons of slag, 35,000 tons of salt, 1 >200 tons of calcium chloride and 45,000 gallons of liquid calcium chloride are used on state roads. The cost of plowing state highways is $6 million to $8 million per year.
Counties and cities also suffer, trying to anticipate and budget for the costs of snow removal. Just knowing total average Snowfall for a year is of little help to planners, because the cost of Plowing five one-inch snowfalls greatly outweighs the cost °f plowing one five-inch snowfall.
Other seasons also bring hazardous travel conditions to the date's roads. Spring floods block travel, often damaging road surfaces. Because of its location in the central Great Plains, Nebraska experiences wide day-to-day and season-to-season temperature fluctuations, causing rapid expansion and connection of road surfaces and contributing heavily to their eventyal crumbling. Most damaging are winter and summer extremes. Bitter cold makes asphalt brittle and vulnerable to under the surface, which expands as it freezes, and to the heavy steel blades of snowplows and graders. Searing summer temperatures can lead to buckling and shifting, somemes creating impassable barriers of concrete or asphalt.
Railroads also are affected by the weather. Like roads, tracks have to be plowed, and spring flooding can damage track beds. Extreme heat also is damaging to rails, and expansion can cause "sun kinks," bends that can derail a train. Inspectors tediously walk sections of track in summer, looking for heat-stressed rails.
The principal hazard to river traffic is the winter freeze. The state's highest volume of river traffic, about 2 million tons of barge cargo annually, is on the Missouri River between early April and mid-November. Droughts, floods and ice jams sometimes impede river navigation, although dams, including Gavins Point near Yankton, South Dakota, help prevent the kind of flooding that once occurred.
A constantly changing sea of air can make air travel beautiful but it also brings hazards that ground crews, air crews and aircraft designers must overcome. Frost on aircraft wings creates an irregular shape and rough surface, disturbing airflow and decreasing lift, and it must be removed from aircraft wings before takeoff. Even in summer, temperatures at 25,000 feet can be as cold as minus 30. Heaters in the wings help remove any ice that forms, and pilots try to avoid areas where super cooled droplets are present. Supercooled droplets remain liquid water at temperatures far below freezing, but freeze immediately on contact with the wings.
Besides icing, pilots must contend with turbulence and low visibility. Even in fair weather, updrafts can rise faster than 20 feet per second, and, during thunderstorms, updrafts can travel faster than 125 feet per second, more than 80 miles per hour. Low clouds and fog can reduce visibility to near zero, and when weather conditions are below the minimums prescribed for VFR (visual flight rules) flight, pilots use radar and other navigational equipment to fly under instrument flight rules (IFR). Even with the technology that allows pilots to "fly blind," however, air travel, like road, rail and river travel, remains dependent on the weather.
The January-February 1899 cold wave produced two and a half continuous weeks with nights below zero, single-digit temperatures in tropical locations such as New Orleans and Houston and snowfall as far south as Brownsville, Texas. The cold wave of January 1930 also produced two and a half consecutive weeks of nighttime temperatures below zero in Nebraska.
The January-February 1936 cold wave is significant for two reasons. It was followed by the warmest summer on record for Nebraska, and it had a record setting 36 continuous days with temperatures below zero. January-February 1966 brought another brutal cold spell with subzero readings on 14 consecutive days in much of Nebraska. The cold spells of December 1972 and December 1973- January 1974 produced more than two weeks of subzero nighttime temperatures.
92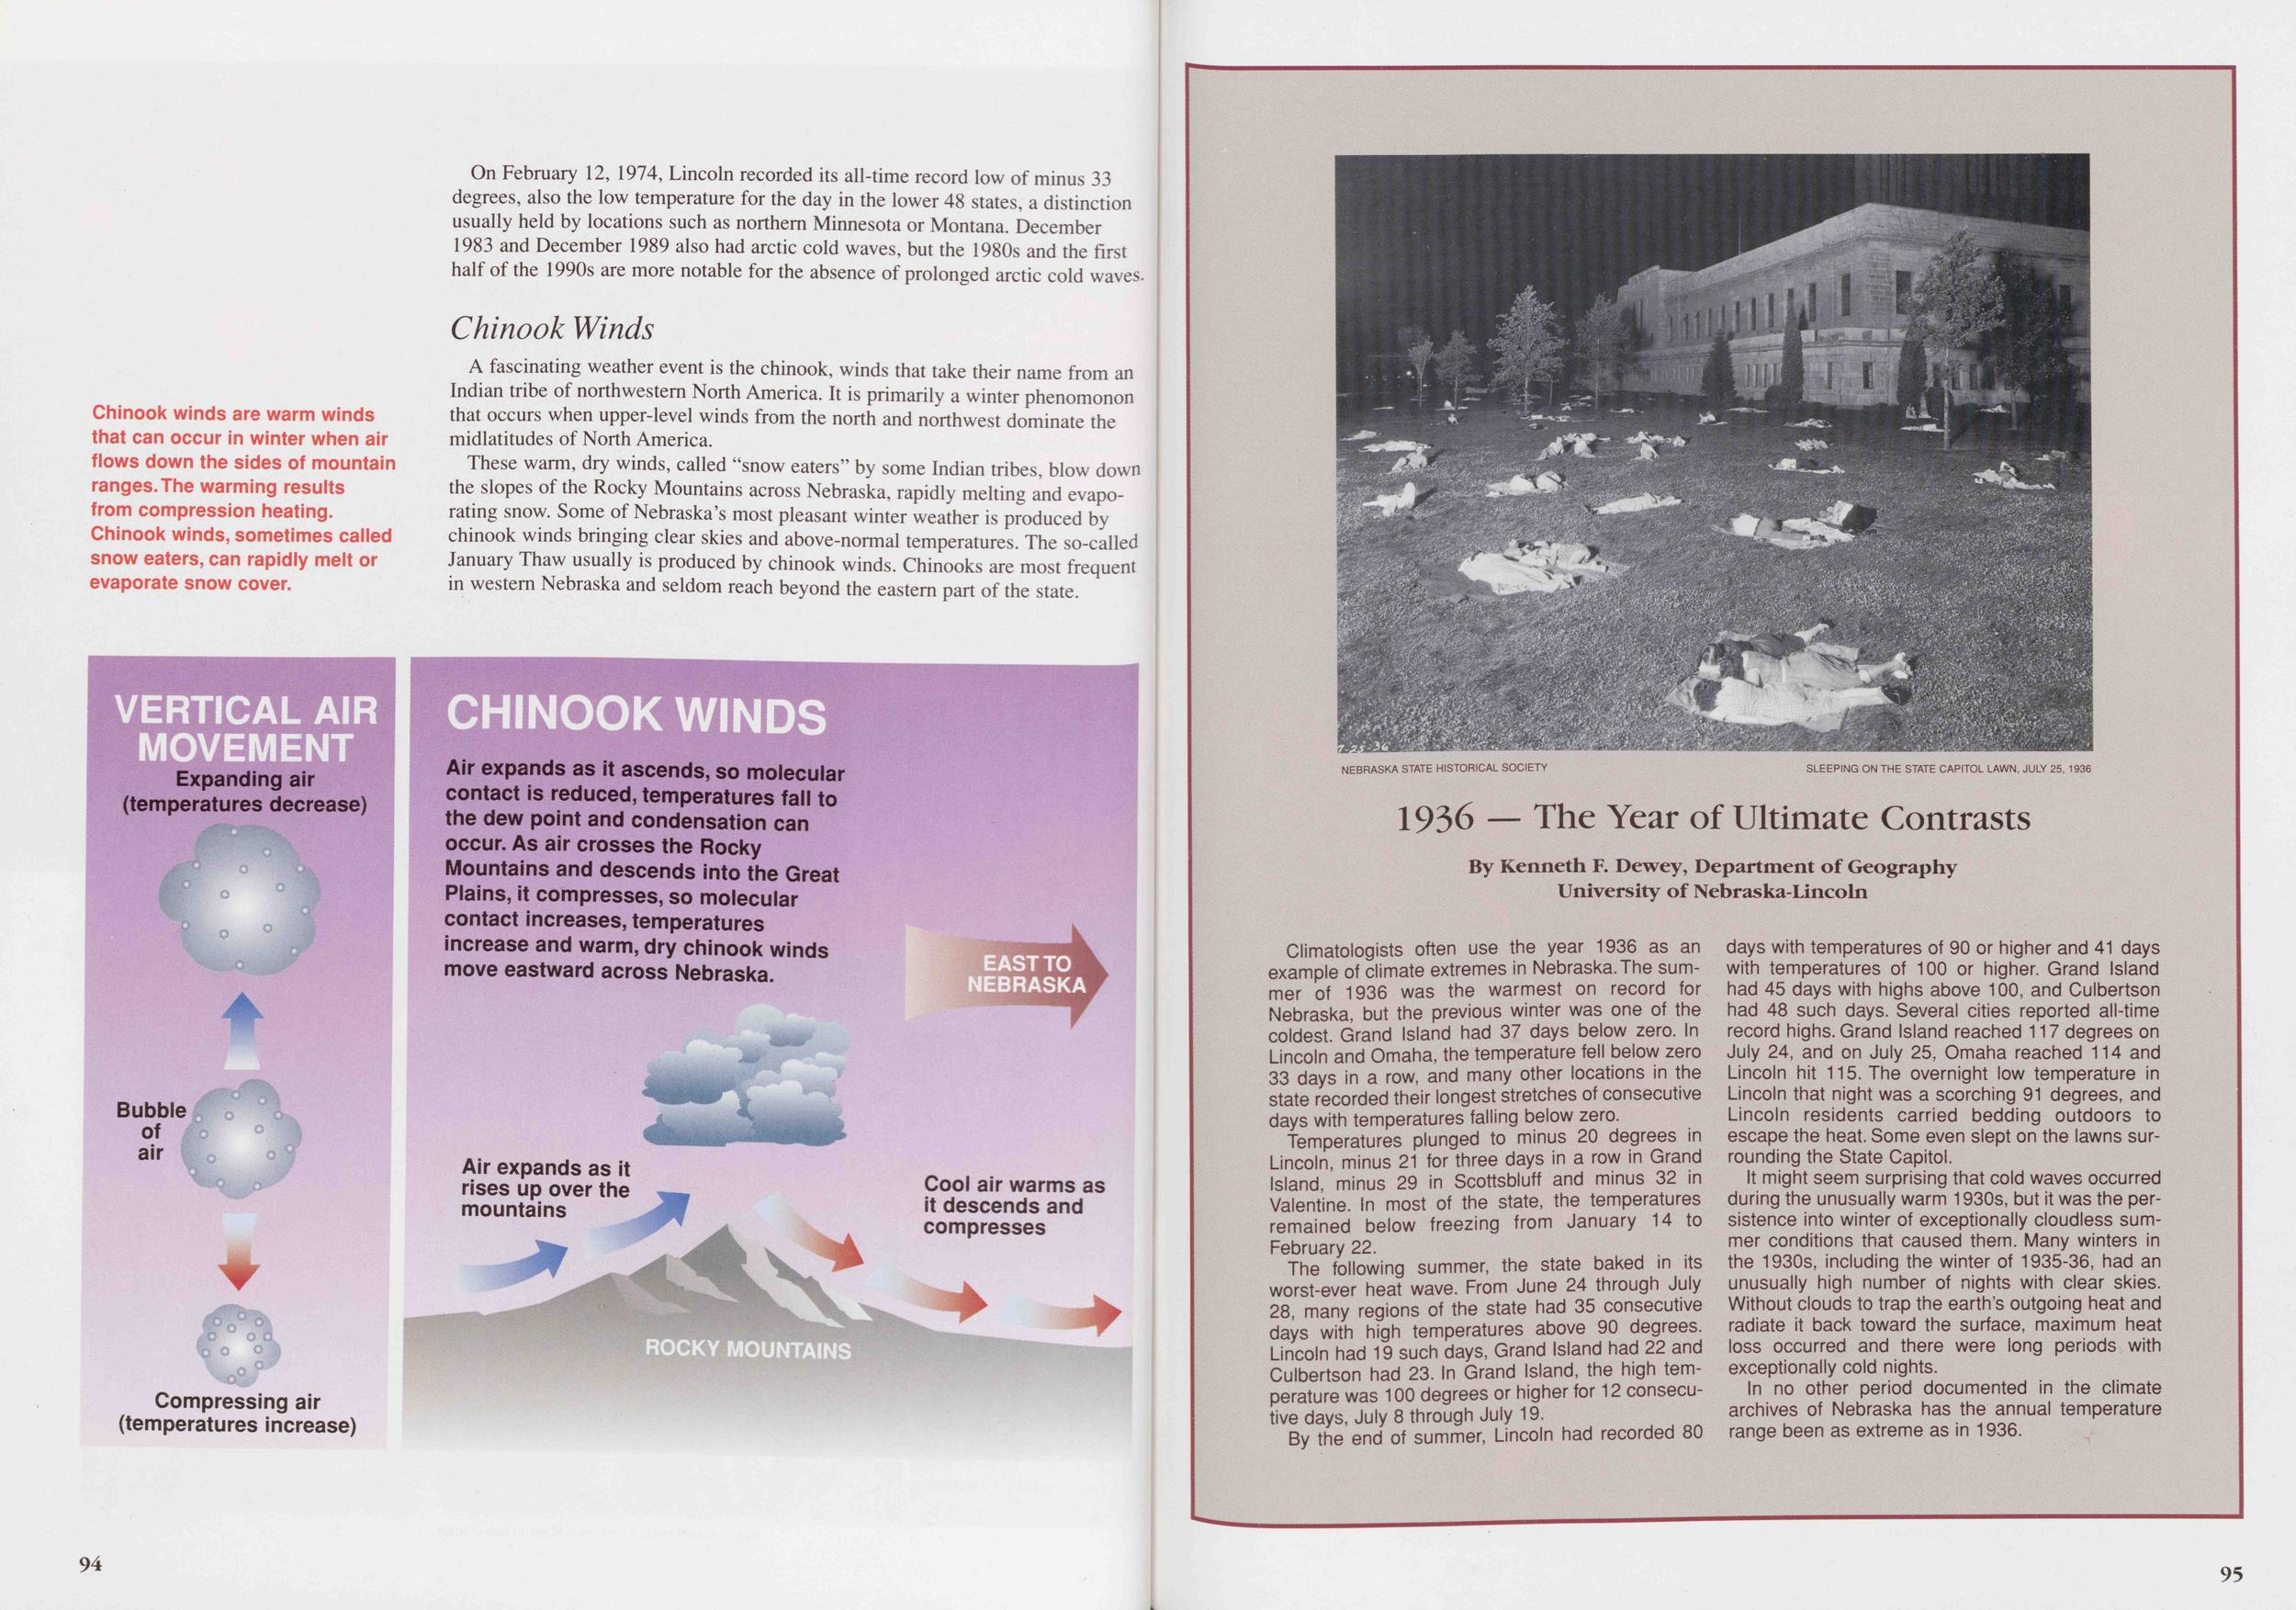
On February 12, 1974, Lincoln recorded its all-time record low of minus 33 degrees, also the low temperature for the day in the lower 48 states, a distinction usually held by locations such as northern Minnesota or Montana. December 1983 and December 1989 also had arctic cold waves, but the 1980s and the first half of the 1990s are more notable for the absence of prolonged arctic cold waves.
Chinook WindsA fascinating weather event is the chinook, winds that take their name from an Indian tribe of northwestern North America. It is primarily a winter phenomenon that occurs when upper-level winds from the north and northwest dominate the midlatitudes of North America.
These warm, dry winds, called "snow eaters" by some Indian tribes, blow down the slopes of the Rocky Mountains across Nebraska, rapidly melting and evaporating snow. Some of Nebraska's most pleasant winter weather is produced by chinook winds bringing clear skies and above-normal temperatures. The so-called January Thaw usually is produced by chinook winds. Chinooks are most frequent in western Nebraska and seldom reach beyond the eastern part of the state.
Climatologists often use the year 1936 as an example of climate extremes in Nebraska. The summer of 1936 was the warmest on record for Nebraska, but the previous winter was one of the coldest. Grand Island had 37 days below zero. In Lincoln and Omaha, the temperature fell below zero 33 days in a row, and many other locations in the state recorded their longest stretches of consecutive days with temperatures falling below zero.
Temperatures plunged to minus 20 degrees in Lincoln, minus 21 for three days in a row in Grand Island, minus 29 in Scottsbluff and minus 32 in Valentine. In most of the state, the temperatures remained below freezing from January 14 to February 22.
The following summer, the state baked in its worst-ever heat wave. From June 24 through July 28, many regions of the state had 35 consecutive days with high temperatures above 90 degrees. Lincoln had 19 such days, Grand Island had 22 and Culbertson had 23. In Grand Island, the high temperature was 100 degrees or higher for 12 consecutive days, July 8 through July 19.
By the end of summer, Lincoln had recorded 80 days with temperatures of 90 or higher and 41 days with temperatures of 100 or higher. Grand Island had 45 days with highs above 100, and Culbertson had 48 such days. Several cities reported all-time record highs. Grand Island reached 117 degrees on July 24, and on July 25, Omaha reached 114 and Lincoln hit 115. The overnight low temperature in Lincoln that night was a scorching 91 degrees, and Lincoln residents carried bedding outdoors to escape the heat. Some even slept on the lawns surounding the State Capitol.
It might seem surprising that cold waves occurred during the unusually warm 1930s, but it was the persistence into winter of exceptionally cloudless summer conditions that caused them. Many winters in the 1930s, including the winter of 1935-36, had an unusually high number of nights with clear skies. Without clouds to trap the earth's outgoing heat and radiate it back toward the surface, maximum heat loss occurred and there were long periods with exceptionally cold nights.
In no other period documented in the climate archives of Nebraska has the annual temperature range been as extreme as in 1936.
95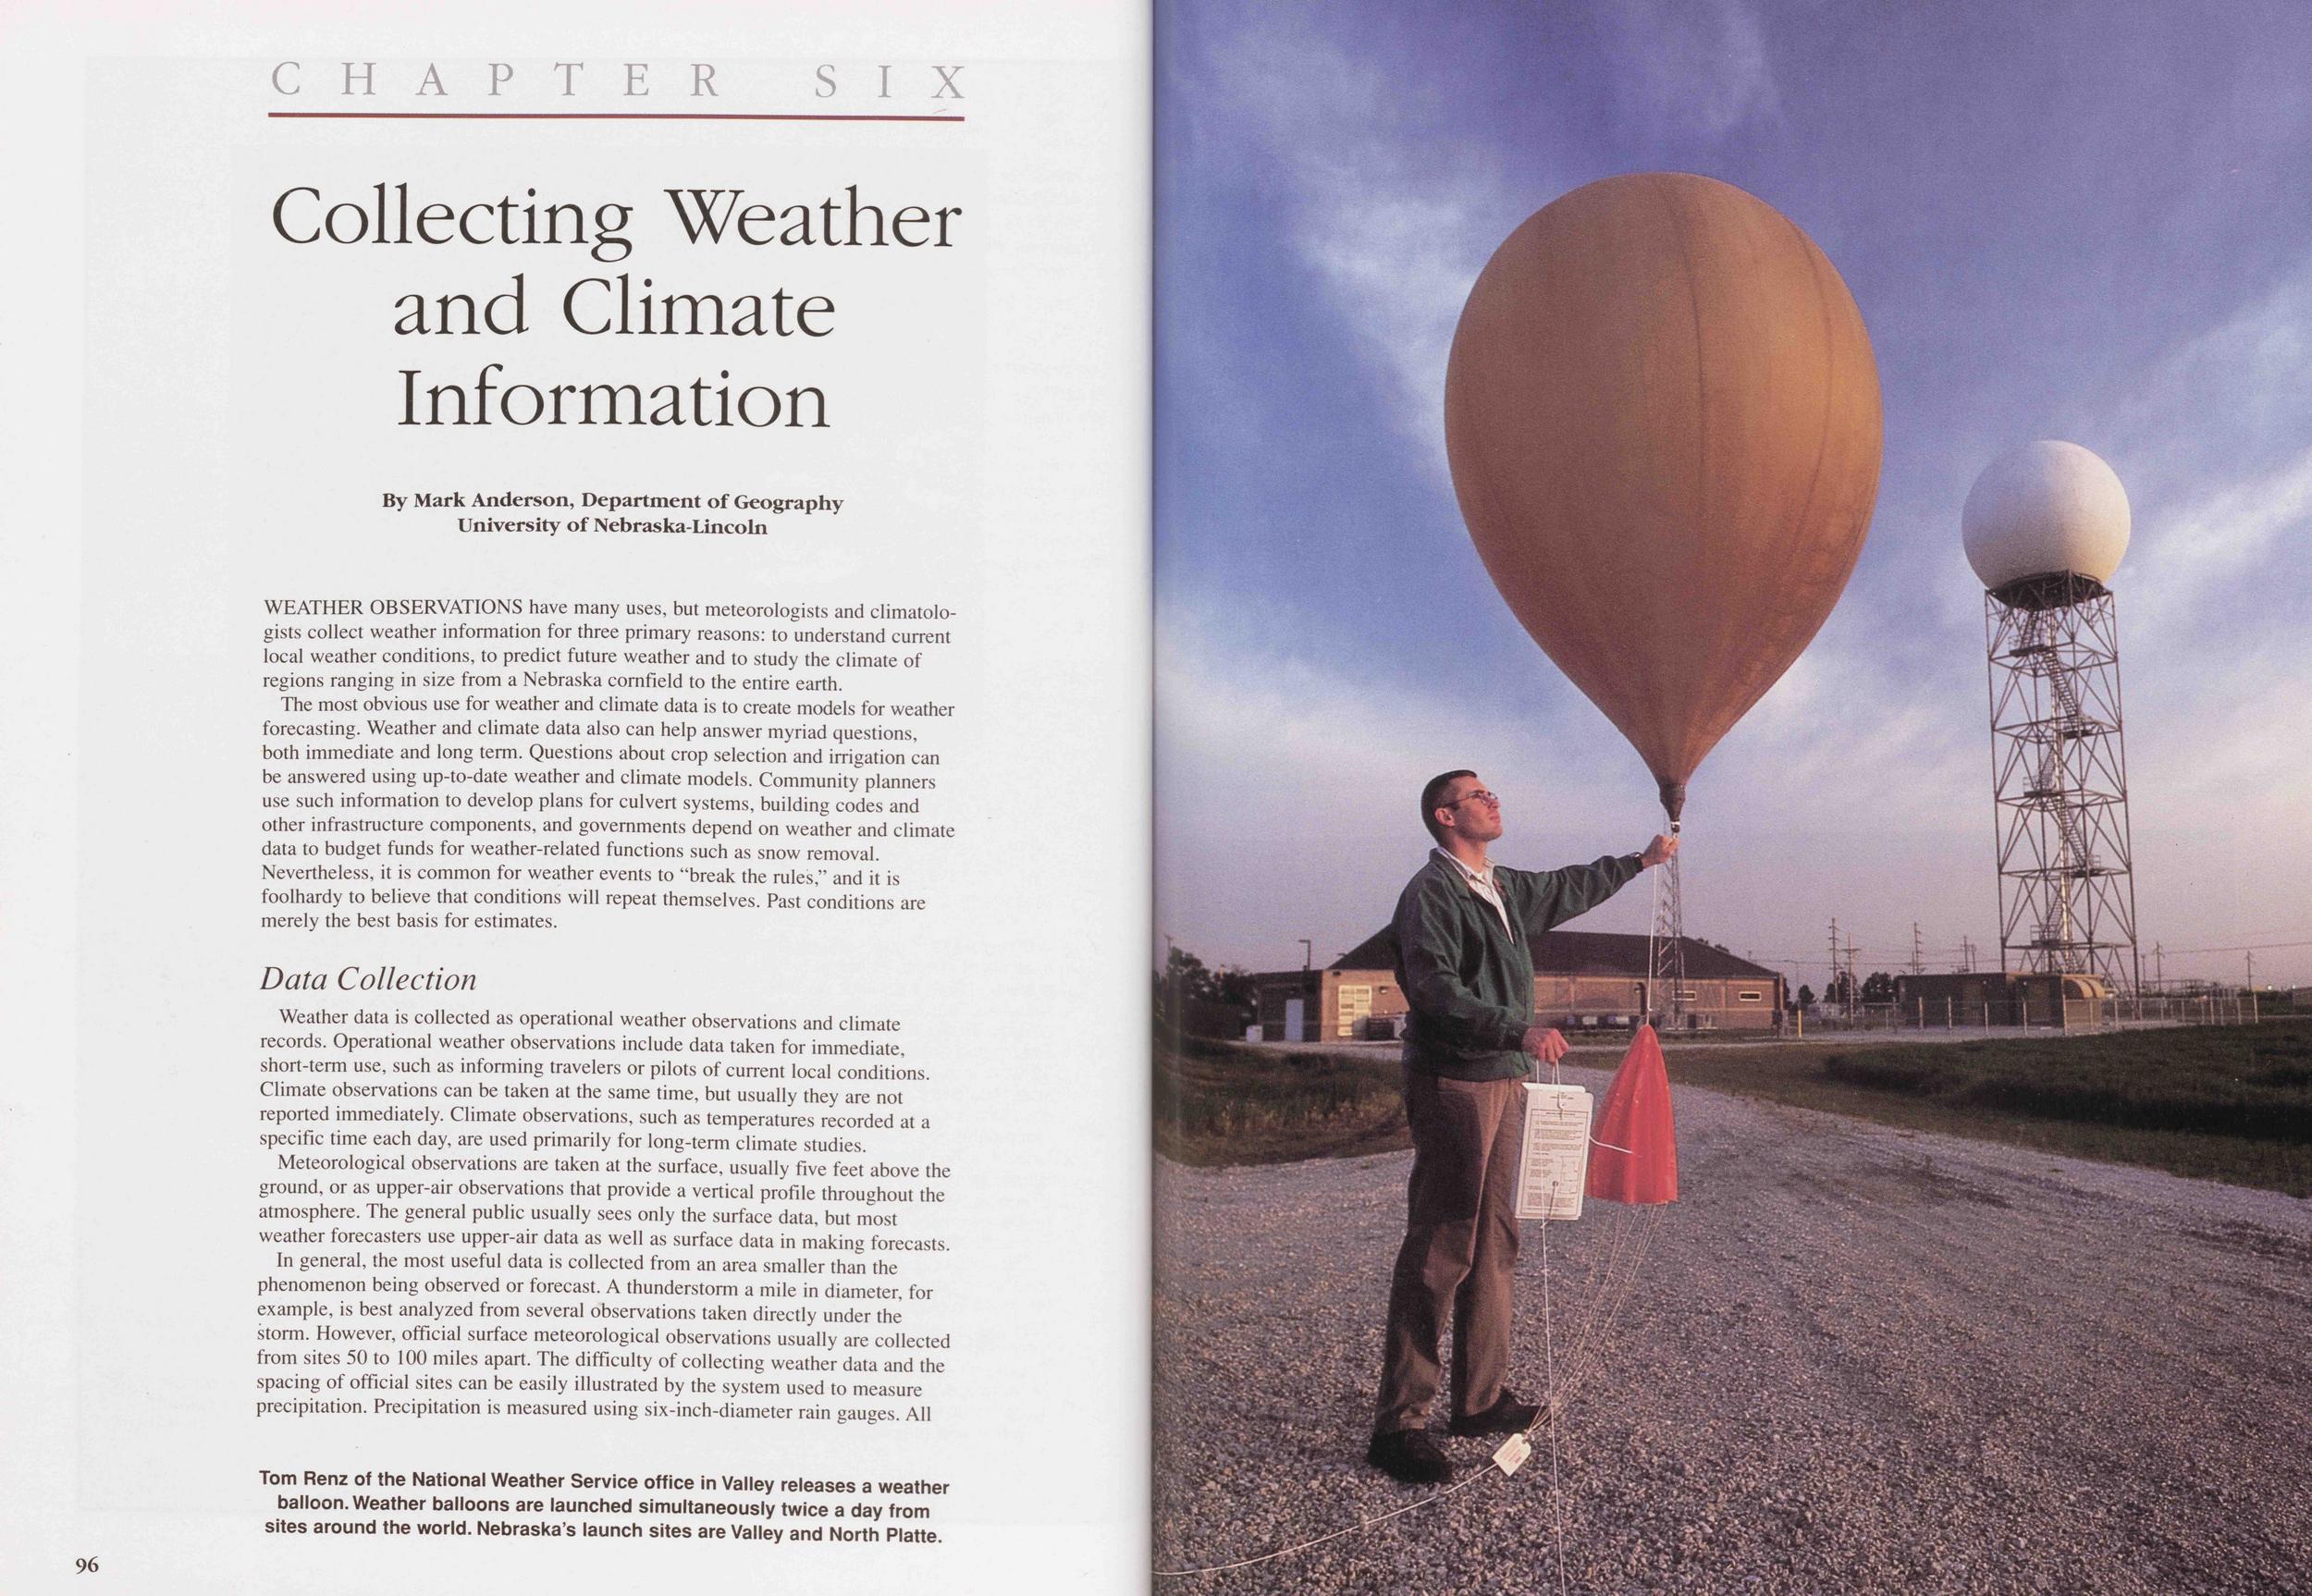
Collecting Weather and Climate Information
By Mark Anderson, Department of Geography University of Nebraska-LincolnWEATHER OBSERVATIONS have many uses, but meteorologists and climatologists collect weather information for three primary reasons: to understand current local weather conditions, to predict future weather and to study the climate of regions ranging in size from a Nebraska cornfield to the entire earth.
The most obvious use for weather and climate data is to create models for weather forecasting. Weather and climate data also can help answer myriad questions, both immediate and long term. Questions about crop selection and irrigation can be answered using up-to-date weather and climate models. Community planners use such information to develop plans for culvert systems, building codes and other infrastructure components, and governments depend on weather and climate data to budget funds for weather-related functions such as snow removal. Nevertheless, it is common for weather events to "break the rules," and it is foolhardy to believe that conditions will repeat themselves. Past conditions are merely the best basis for estimates.
Data CollectionWeather data is collected as operational weather observations and climate records. Operational weather observations include data taken for immediate, short-term use, such as informing travelers or pilots of current local conditions. Climate observations can be taken at the same time, but usually they are not reported immediately. Climate observations, such as temperatures recorded at a specific time each day, are used primarily for long-term climate studies.
Meteorological observations are taken at the surface, usually five feet above the ground, or as upper-air observations that provide a vertical profile throughout the atmosphere. The general public usually sees only the surface data, but most weather forecasters use upper-air data as well as surface data in making forecasts.
In general, the most useful data is collected from an area smaller than the phenomenon being observed or forecast. A thunderstorm a mile in diameter, for example, is best analyzed from several observations taken directly under the storm. However, official surface meteorological observations usually are collected from sites 50 to 100 miles apart. The difficulty of collecting weather data and the spacing of official sites can be easily illustrated by the system used to measure precipitation. Precipitation is measured using six-inch-diameter rain gauges. All 96
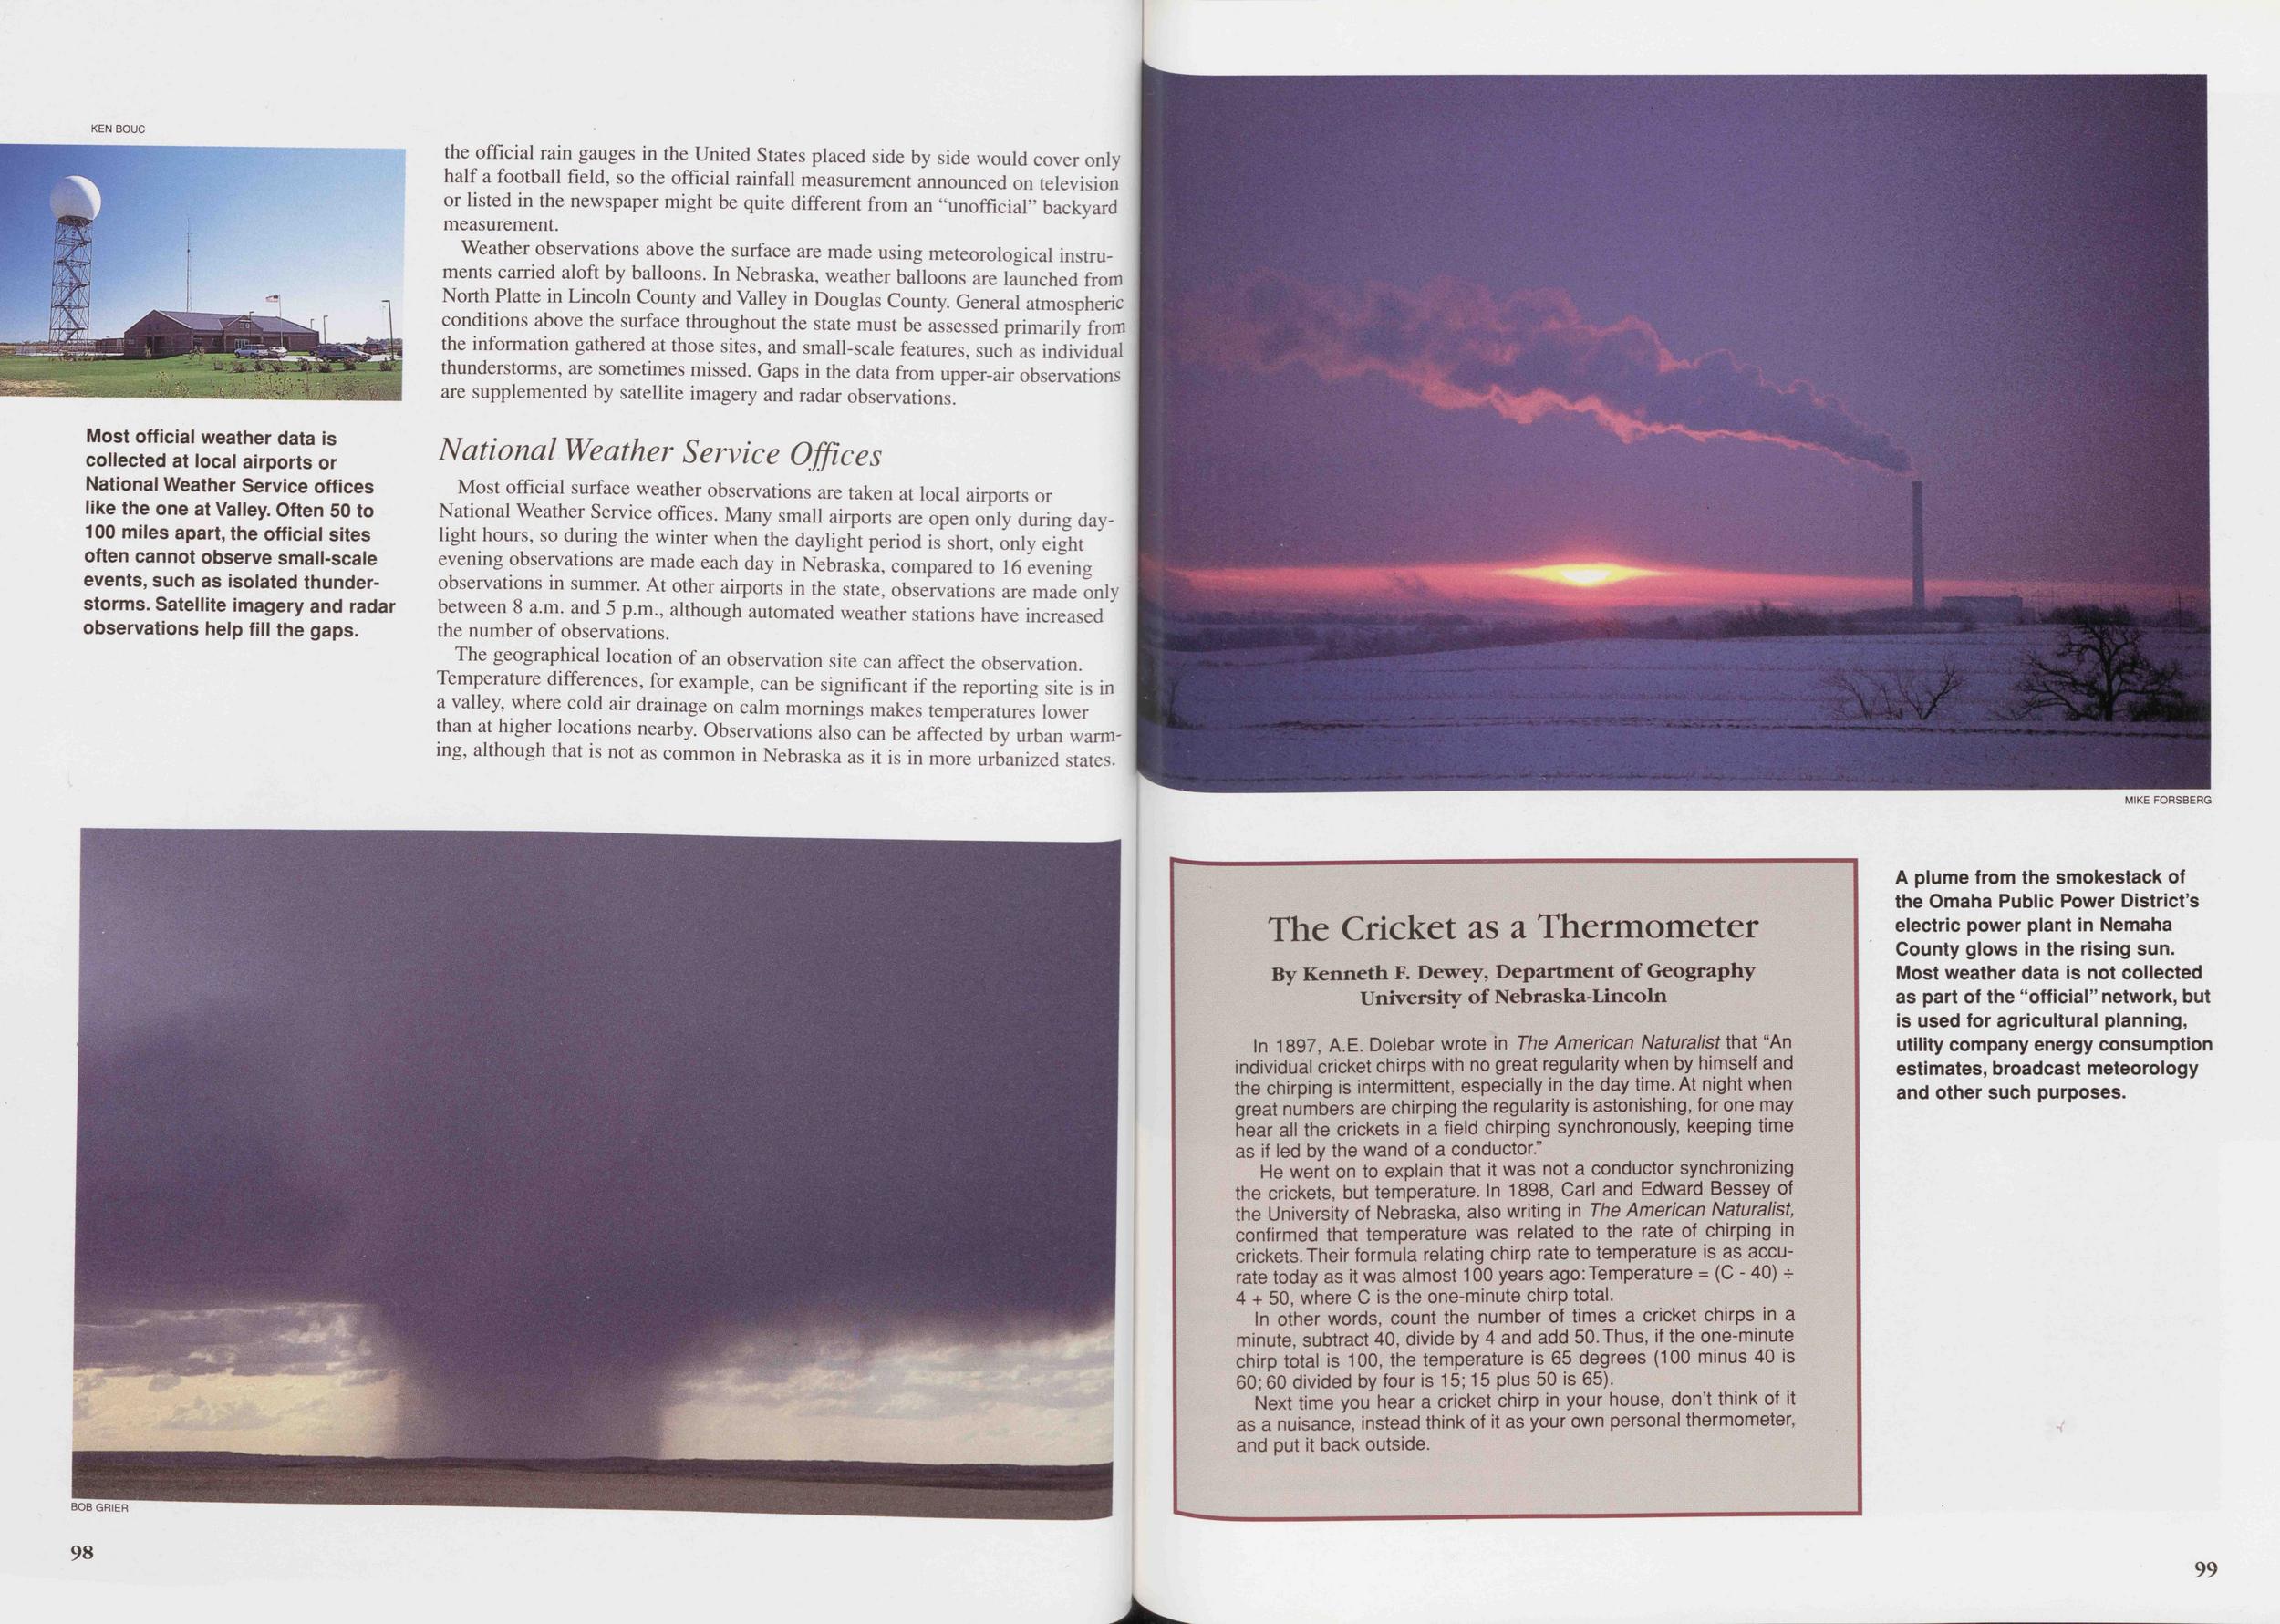
Weather observations above the surface are made using meteorological instruments carried aloft by balloons. In Nebraska, weather balloons are launched from North Platte in Lincoln County and Valley in Douglas County. General atmospheric conditions above the surface throughout the state must be assessed primarily from the information gathered at those sites, and small-scale features, such as individual thunderstorms, are sometimes missed. Gaps in the data from upper-air observations are supplemented by satellite imagery and radar observations.
National Weather Service OfficesMost official surface weather observations are taken at local airports or National Weather Service offices. Many small airports are open only during daylight hours, so during the winter when the daylight period is short, only eight evening observations are made each day in Nebraska, compared to 16 evening : observations in summer. At other airports in the state, observations are made only between 8 a.m. and 5 p.m., although automated weather stations have increased the number of observations.
The geographical location of an observation site can affect the observation. Temperature differences, for example, can be significant if the reporting site is in a valley, where cold air drainage on calm mornings makes temperatures lower than at higher locations nearby. Observations also can be affected by urban warming, although that is not as common in Nebraska as it is in more urbanized states.
In 1897, A.E. Dolebar wrote in The American Naturalist that "An individual cricket chirps with no great regularity when by himself and the chirping is intermittent, especially in the day time. At night when great numbers are chirping the regularity is astonishing, for one may hear all the crickets in a field chirping synchronously, keeping time as if led by the wand of a conductor."
He went on to explain that it was not a conductor synchronizing the crickets, but temperature. In 1898, Carl and Edward Bessey of the University of Nebraska, also writing in The American Naturalist, confirmed that temperature was related to the rate of chirping in crickets. Their formula relating chirp rate to temperature is as accurate today as it was almost 100 years ago:Temperature - (C - 40) -f 4 + 50, where C is the one-minute chirp total.
In other words, count the number of times a cricket chirps in a minute, subtract 40, divide by 4 and add 50. Thus, if the one-minute chirp total is 100, the temperature is 65 degrees (100 minus 40 is 60; 60 divided by four is 15; 15 plus 50 is 65).
Next time you hear a cricket chirp in your house, don't think of it as a nuisance, instead think of it as your own personal thermometer, and put it back outside.
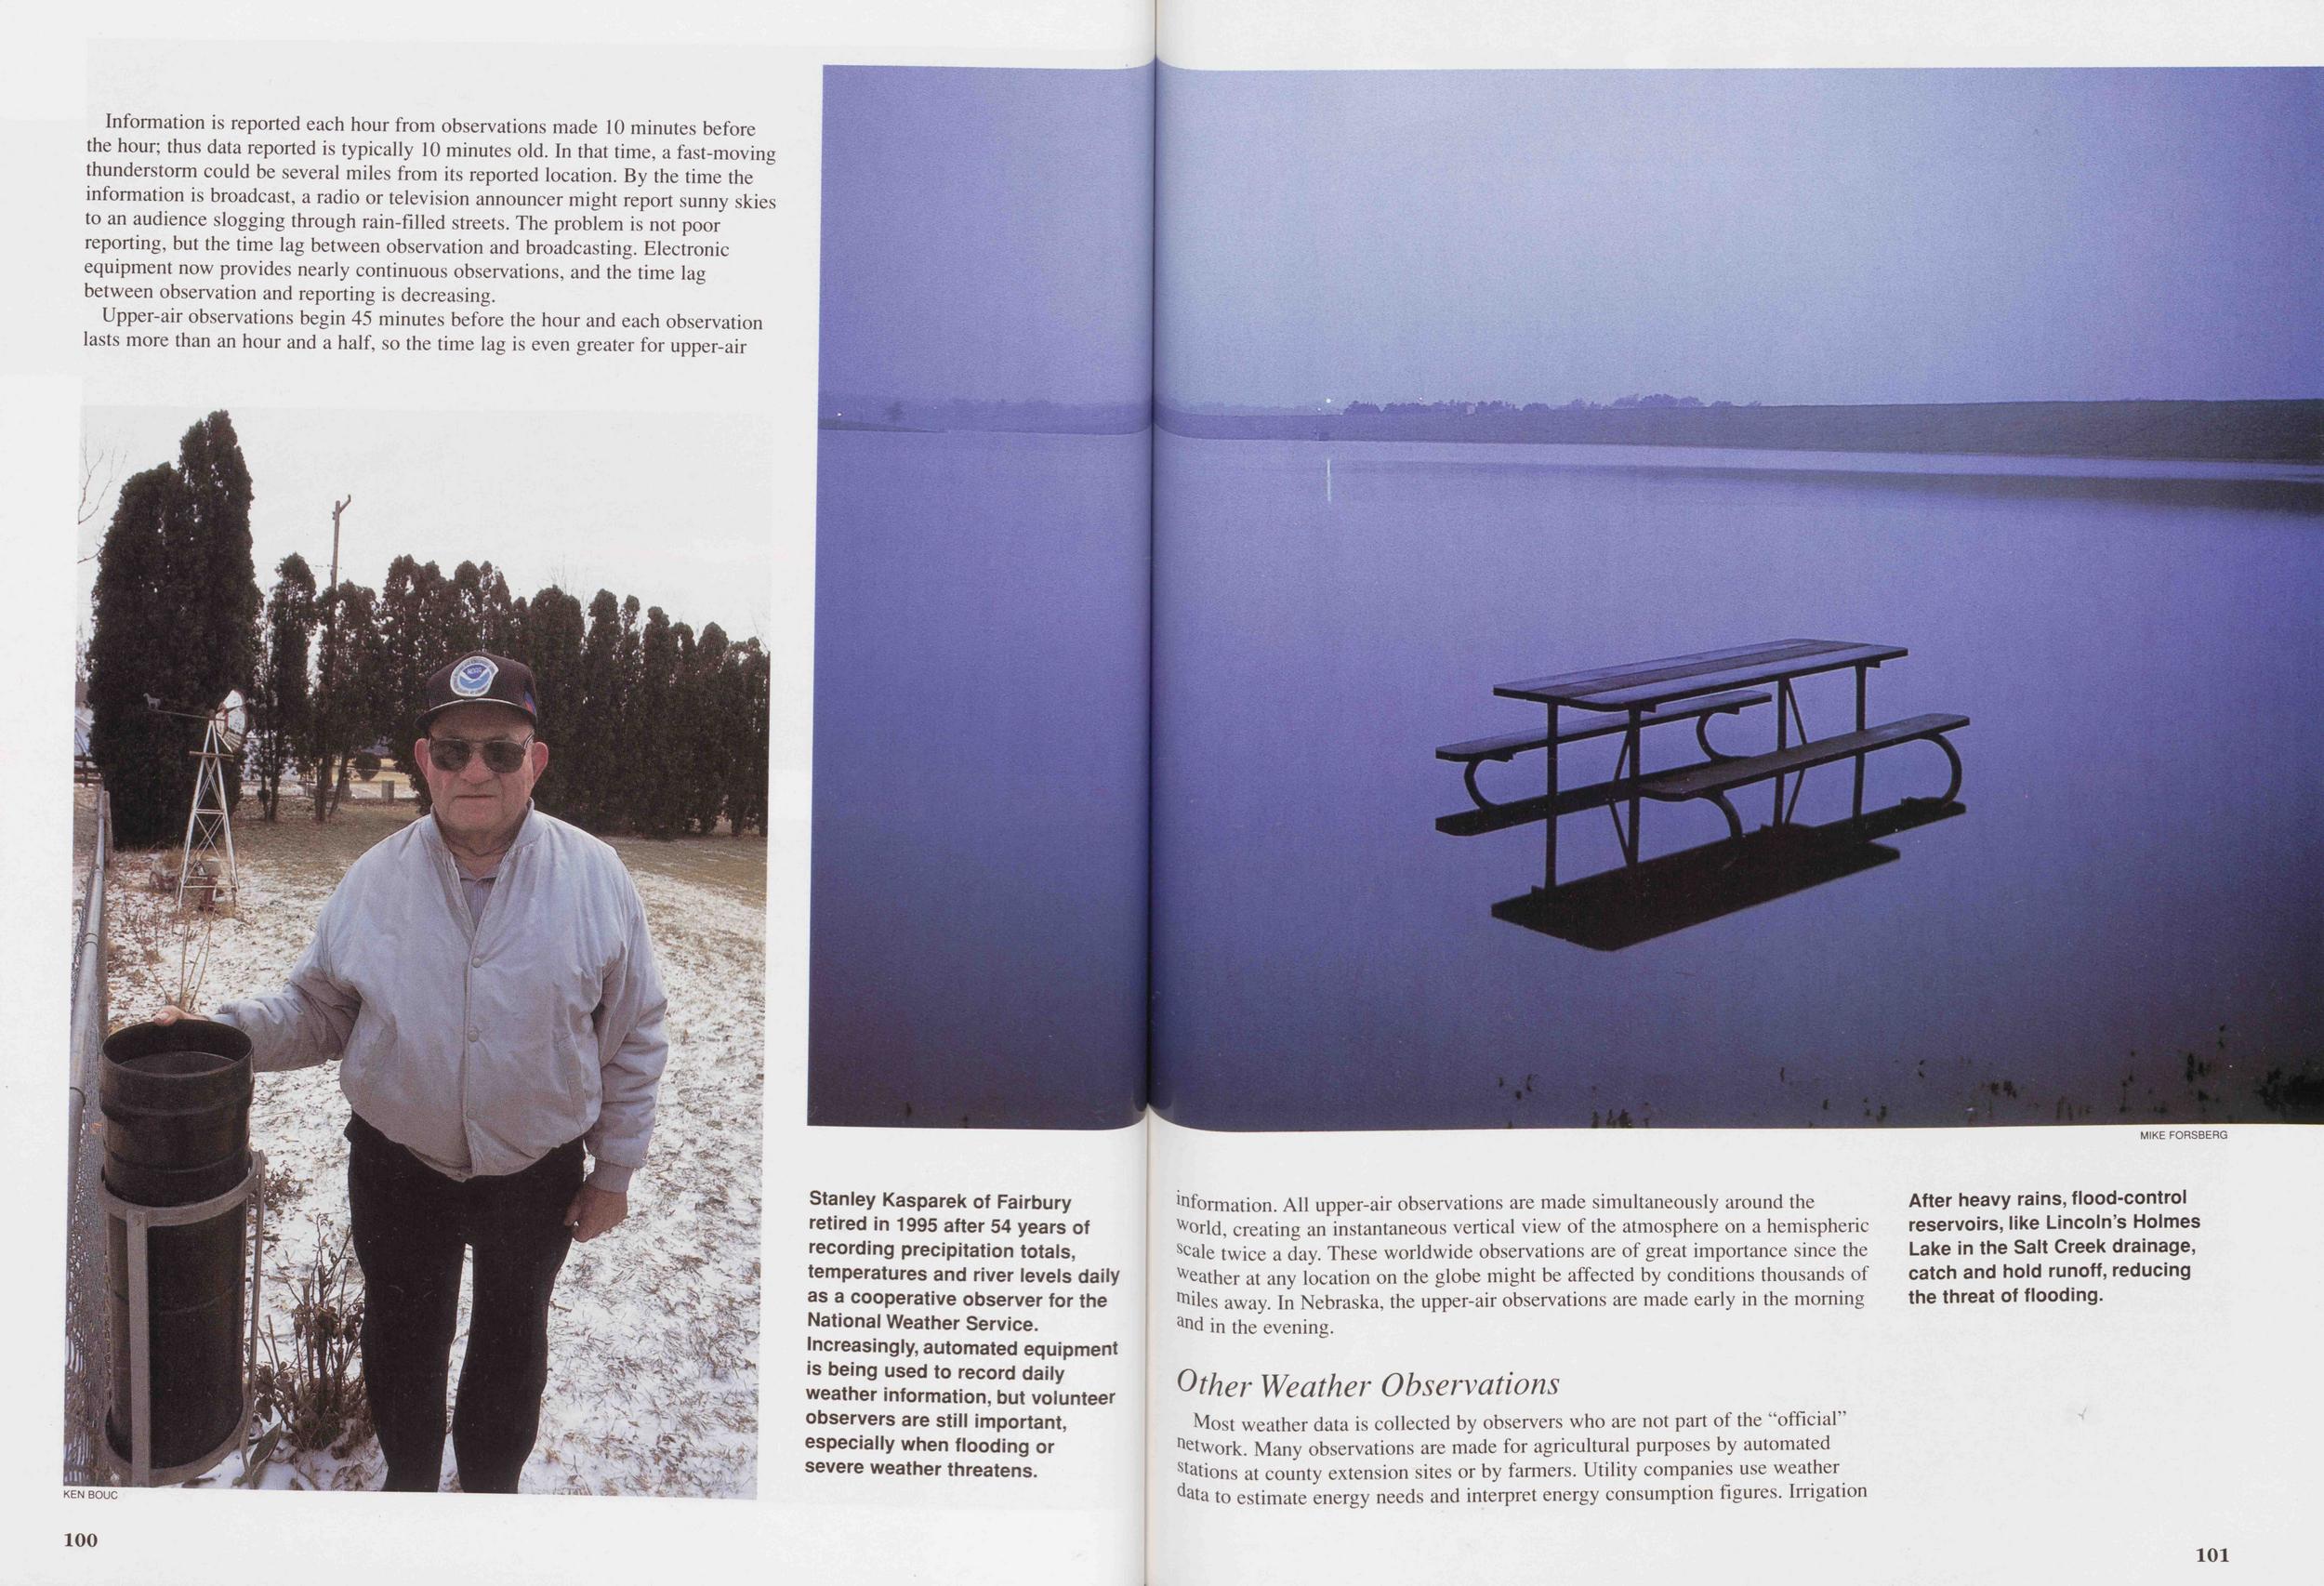
Information is reported each hour from observations made 10 minutes before the hour; thus data reported is typically 10 minutes old. In that time, a fast-moving thunderstorm could be several miles from its reported location. By the time the information is broadcast, a radio or television announcer might report sunny skies to an audience slogging through rain-filled streets. The problem is not poor reporting, but the time lag between observation and broadcasting. Electronic equipment now provides nearly continuous observations, and the time lag between observation and reporting is decreasing.
Upper-air observations begin 45 minutes before the hour and each observation lasts more than an hour and a half, so the time lag is even greater for upper-air
Other Weather Observations
Most weather data is collected by observers who are not part of the "official" network. Many observations are made for agricultural purposes by automated Nations at county extension sites or by farmers. Utility companies use weather ^ata to estimate energy needs and interpret energy consumption figures. Irrigation districts collect meteorological observations to determine evaporation rates and Water usage. Newspapers and radio and television stations also collect weather observations. Little of the "unofficial" data is given to weather forecasters or archived in the climate record. The same is true of the weather records kept by many amateur meteorologists. As electronic communication systems such as the Internet become more accessible, more unofficial weather and climate data will become available.
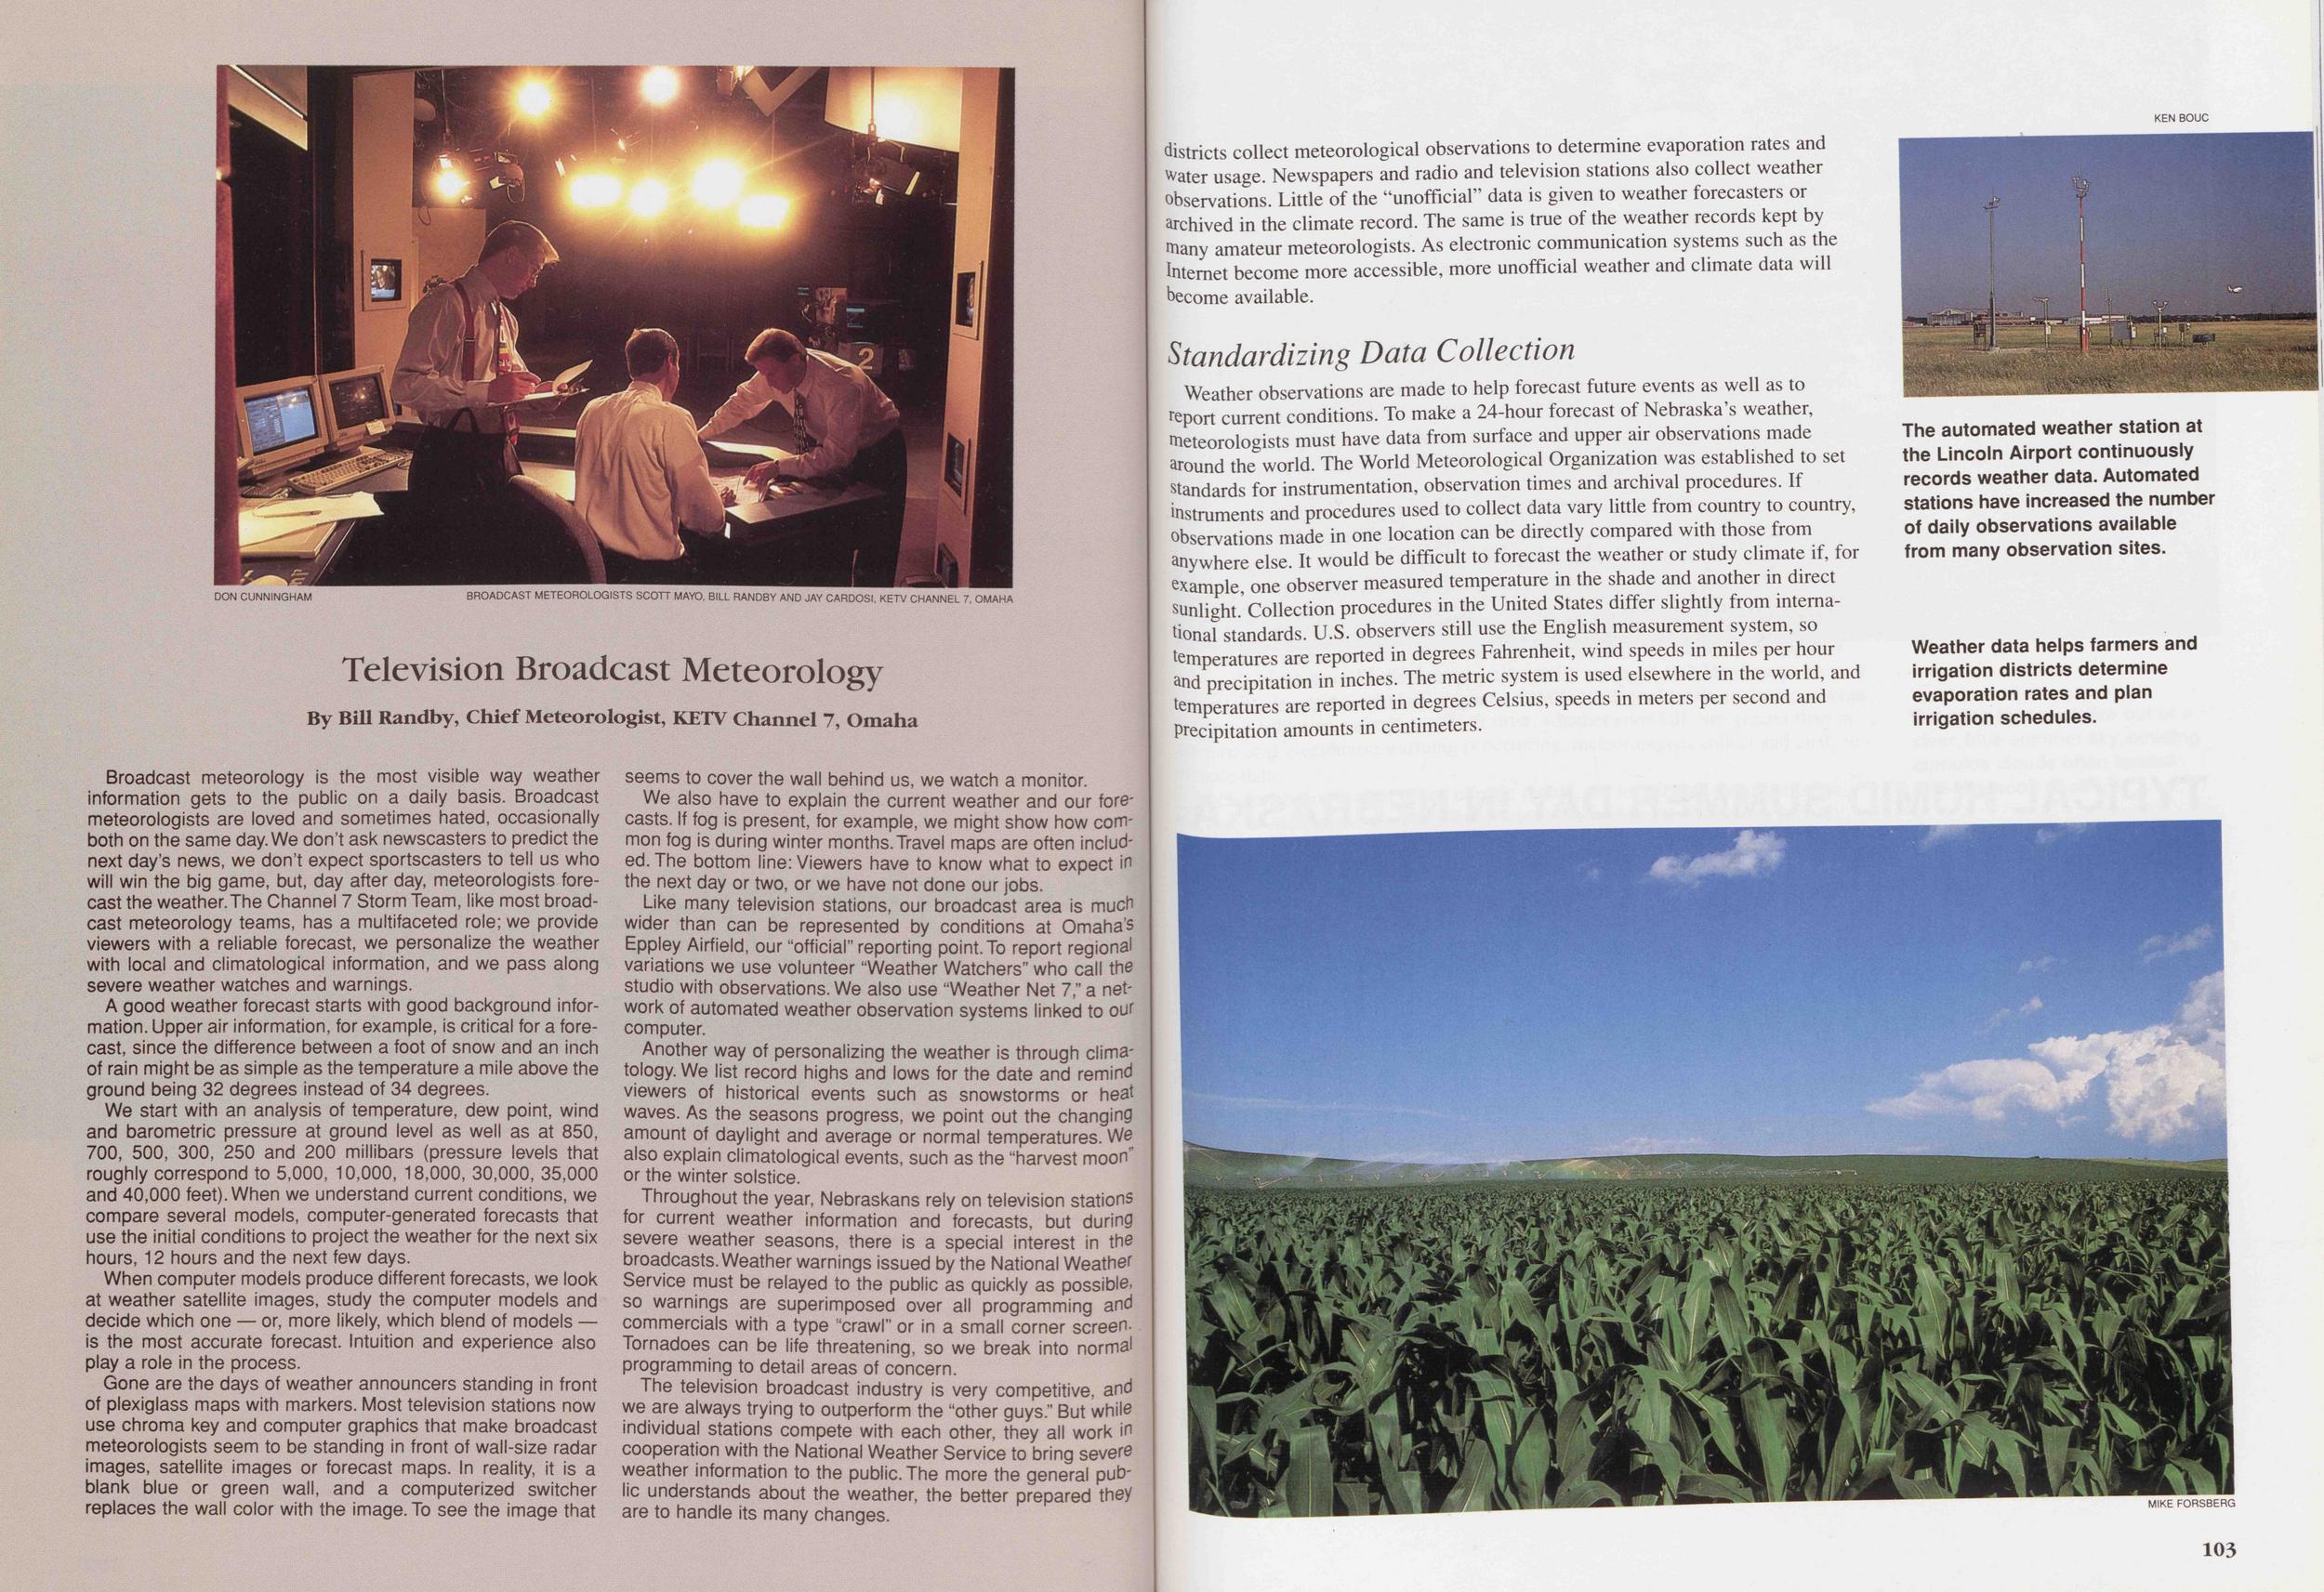
Broadcast meteorology is the most visible way weather information gets to the public on a daily basis. Broadcast meteorologists are loved and sometimes hated, occasionally both on the same day. We don't ask newscasters to predict the next day's news, we don't expect sportscasters to tell us who will win the big game, but, day after day, meteorologists forecast the weather.The Channel 7 Storm Team, like most broadcast meteorology teams, has a multifaceted role; we provide viewers with a reliable forecast, we personalize the weather with local and climatological information, and we pass along severe weather watches and warnings.
A good weather forecast starts with good background information. Upper air information, for example, is critical for a forecast, since the difference between a foot of snow and an inch of rain might be as simple as the temperature a mile above the ground being 32 degrees instead of 34 degrees.
We start with an analysis of temperature, dew point, wind and barometric pressure at ground level as well as at 850, 700, 500, 300, 250 and 200 millibars (pressure levels that roughly correspond to 5,000, 10,000, 18,000, 30,000, 35,000 and 40,000 feet). When we understand current conditions, we compare several models, computer-generated forecasts that use the initial conditions to project the weather for the next six hours, 12 hours and the next few days.
When computer models produce different forecasts, we look at weather satellite images, study the computer models and decide which one — or, more likely, which blend of models — is the most accurate forecast. Intuition and experience also play a role in the process.
Gone are the days of weather announcers standing in front of plexiglass maps with markers. Most television stations now use chroma key and computer graphics that make broadcast meteorologists seem to be standing in front of wall-size radar images, satellite images or forecast maps. In reality, it is a blank blue or green wall, and a computerized switcher replaces the wall color with the image. To see the image that seems to cover the wall behind us, we watch a monitor.
We also have to explain the current weather and our forecasts. If fog is present, for example, we might show how common fog is during winter months.Travel maps are often included. The bottom line: Viewers have to know what to expect in the next day or two, or we have not done our jobs.
Like many television stations, our broadcast area is much wider than can be represented by conditions at Omaha's Eppley Airfield, our "official" reporting point. To report regional variations we use volunteer "Weather Watchers" who call the studio with observations. We also use "Weather Net 7," a network of automated weather observation systems linked to our computer.
Another way of personalizing the weather is through climatology. We list record highs and lows for the date and remind viewers of historical events such as snowstorms or heat waves. As the seasons progress, we point out the changing amount of daylight and average or normal temperatures. Wa also explain climatological events, such as the "harvest moon" or the winter solstice.
Throughout the year, Nebraskans rely on television stations for current weather information and forecasts, but during severe weather seasons, there is a special interest in the broadcasts. Weather warnings issued by the National Weather Service must be relayed to the public as quickly as possible, so warnings are superimposed over all programming and commercials with a type ''crawl" or in a small corner screen. Tornadoes can be life threatening, so we break into normal programming to detail areas of concern.
The television broadcast industry is very competitive, and we are always trying to outperform the "other guys." But while individual stations compete with each other, they all work in cooperation with the National Weather Service to bring severe weather information to the public. The more the general public understands about the weather, the better prepared they are to handle its many changes.
Standardizing Data CollectionWeather observations are made to help forecast future events as well as to report current conditions. To make a 24-hour forecast of Nebraska's weather, meteorologists must have data from surface and upper air observations made around the world. The World Meteorological Organization was established to set standards for instrumentation, observation times and archival procedures. If instruments and procedures used to collect data vary little from country to country, observations made in one location can be directly compared with those from anywhere else. It would be difficult to forecast the weather or study climate if, for example, one observer measured temperature in the shade and another in direct sunlight'Collection procedures in the United States differ slightly from international standards. U.S. observers still use the English measurement system, so temperatures are reported in degrees Fahrenheit, wind speeds in miles per hour and precipitation in inches. The metric system is used elsewhere in the world, and temperatures are reported in degrees Celsius, speeds in meters per second and Precipitation amounts in centimeters.
Forecasters consider their 24-hour forecasts to be accurate about 95 percent of the time and their 48-hour forecasts about 90 percent of the time. When the forecast period increases to five days, they rate their accuracy at 60 percent. Forecast accuracy is highest where the weather changes very little, such as the desert Southwest or the Pacific Northwest, and forecast accuracy is lowest in the Great Plains, where weather can change suddenly.
Recently, the National Weather Service began issuing experimental forecasts for seven to 10 days using a medium-range forecast model. Because the accuracy of forecasts beyond that range is low, the National Weather Service substitutes the word "outlook" for "forecast" in its Monthly Climate Outlooks and Seasonal Climate Outlooks. Outlooks do not give specific indications of a sequence of weather events, but indicate general trends of precipitation and temperature relative to normal.
In 1995, the National Weather Service began issuing highly experimental climate outlooks for periods up to a year. Although long-term outlooks can be valuable for planning purposes, they must be used cautiously.
ClimatologyWeather observations become climate data when they are no longer current; thus all operational data becomes climate data by default. Climate data helps answer questions about long-term climate changes. To learn if Nebraska's climate
Once data becomes part of the climate record, the location of the observation, the type of instrument used, the observation time and the observer also become Part of the record. In spite of the limitations inherent in analyzing data collected With non-standardized instruments, locations and times, the climate record is a Useful tool for understanding current and past weather conditions.
Sources of Weather and Climate Information Data Sources High Plains Climate Center LWC 242 University of Nebraska-Lincoln Lincoln, NE 68588-0728 (402) 472-6706 National Climatic Data Center Federal Building 151 Patton Ave. Asheville, NC 28801-5001 (704)271-4800 Weekly Weather and Crop Bulletin NOAA/USDA Joint Agricultural Weather Facility USDA South Building, Room 5844 Washington, D.C. 20250 Meteorology Professional Organizations American Meteorological Society 45 Beacon St. Boston, MA 02108 (617)227-2425 National Weather Association 6704 Wolke Court Montgomery, AL 36116-2134 (304) 345-7460 National Weather Service Public Affairs Office 1325 East-West Highway SSMCII-Room 18454, EA5/W Silver Springs, MD 20910 (301)713-0689 105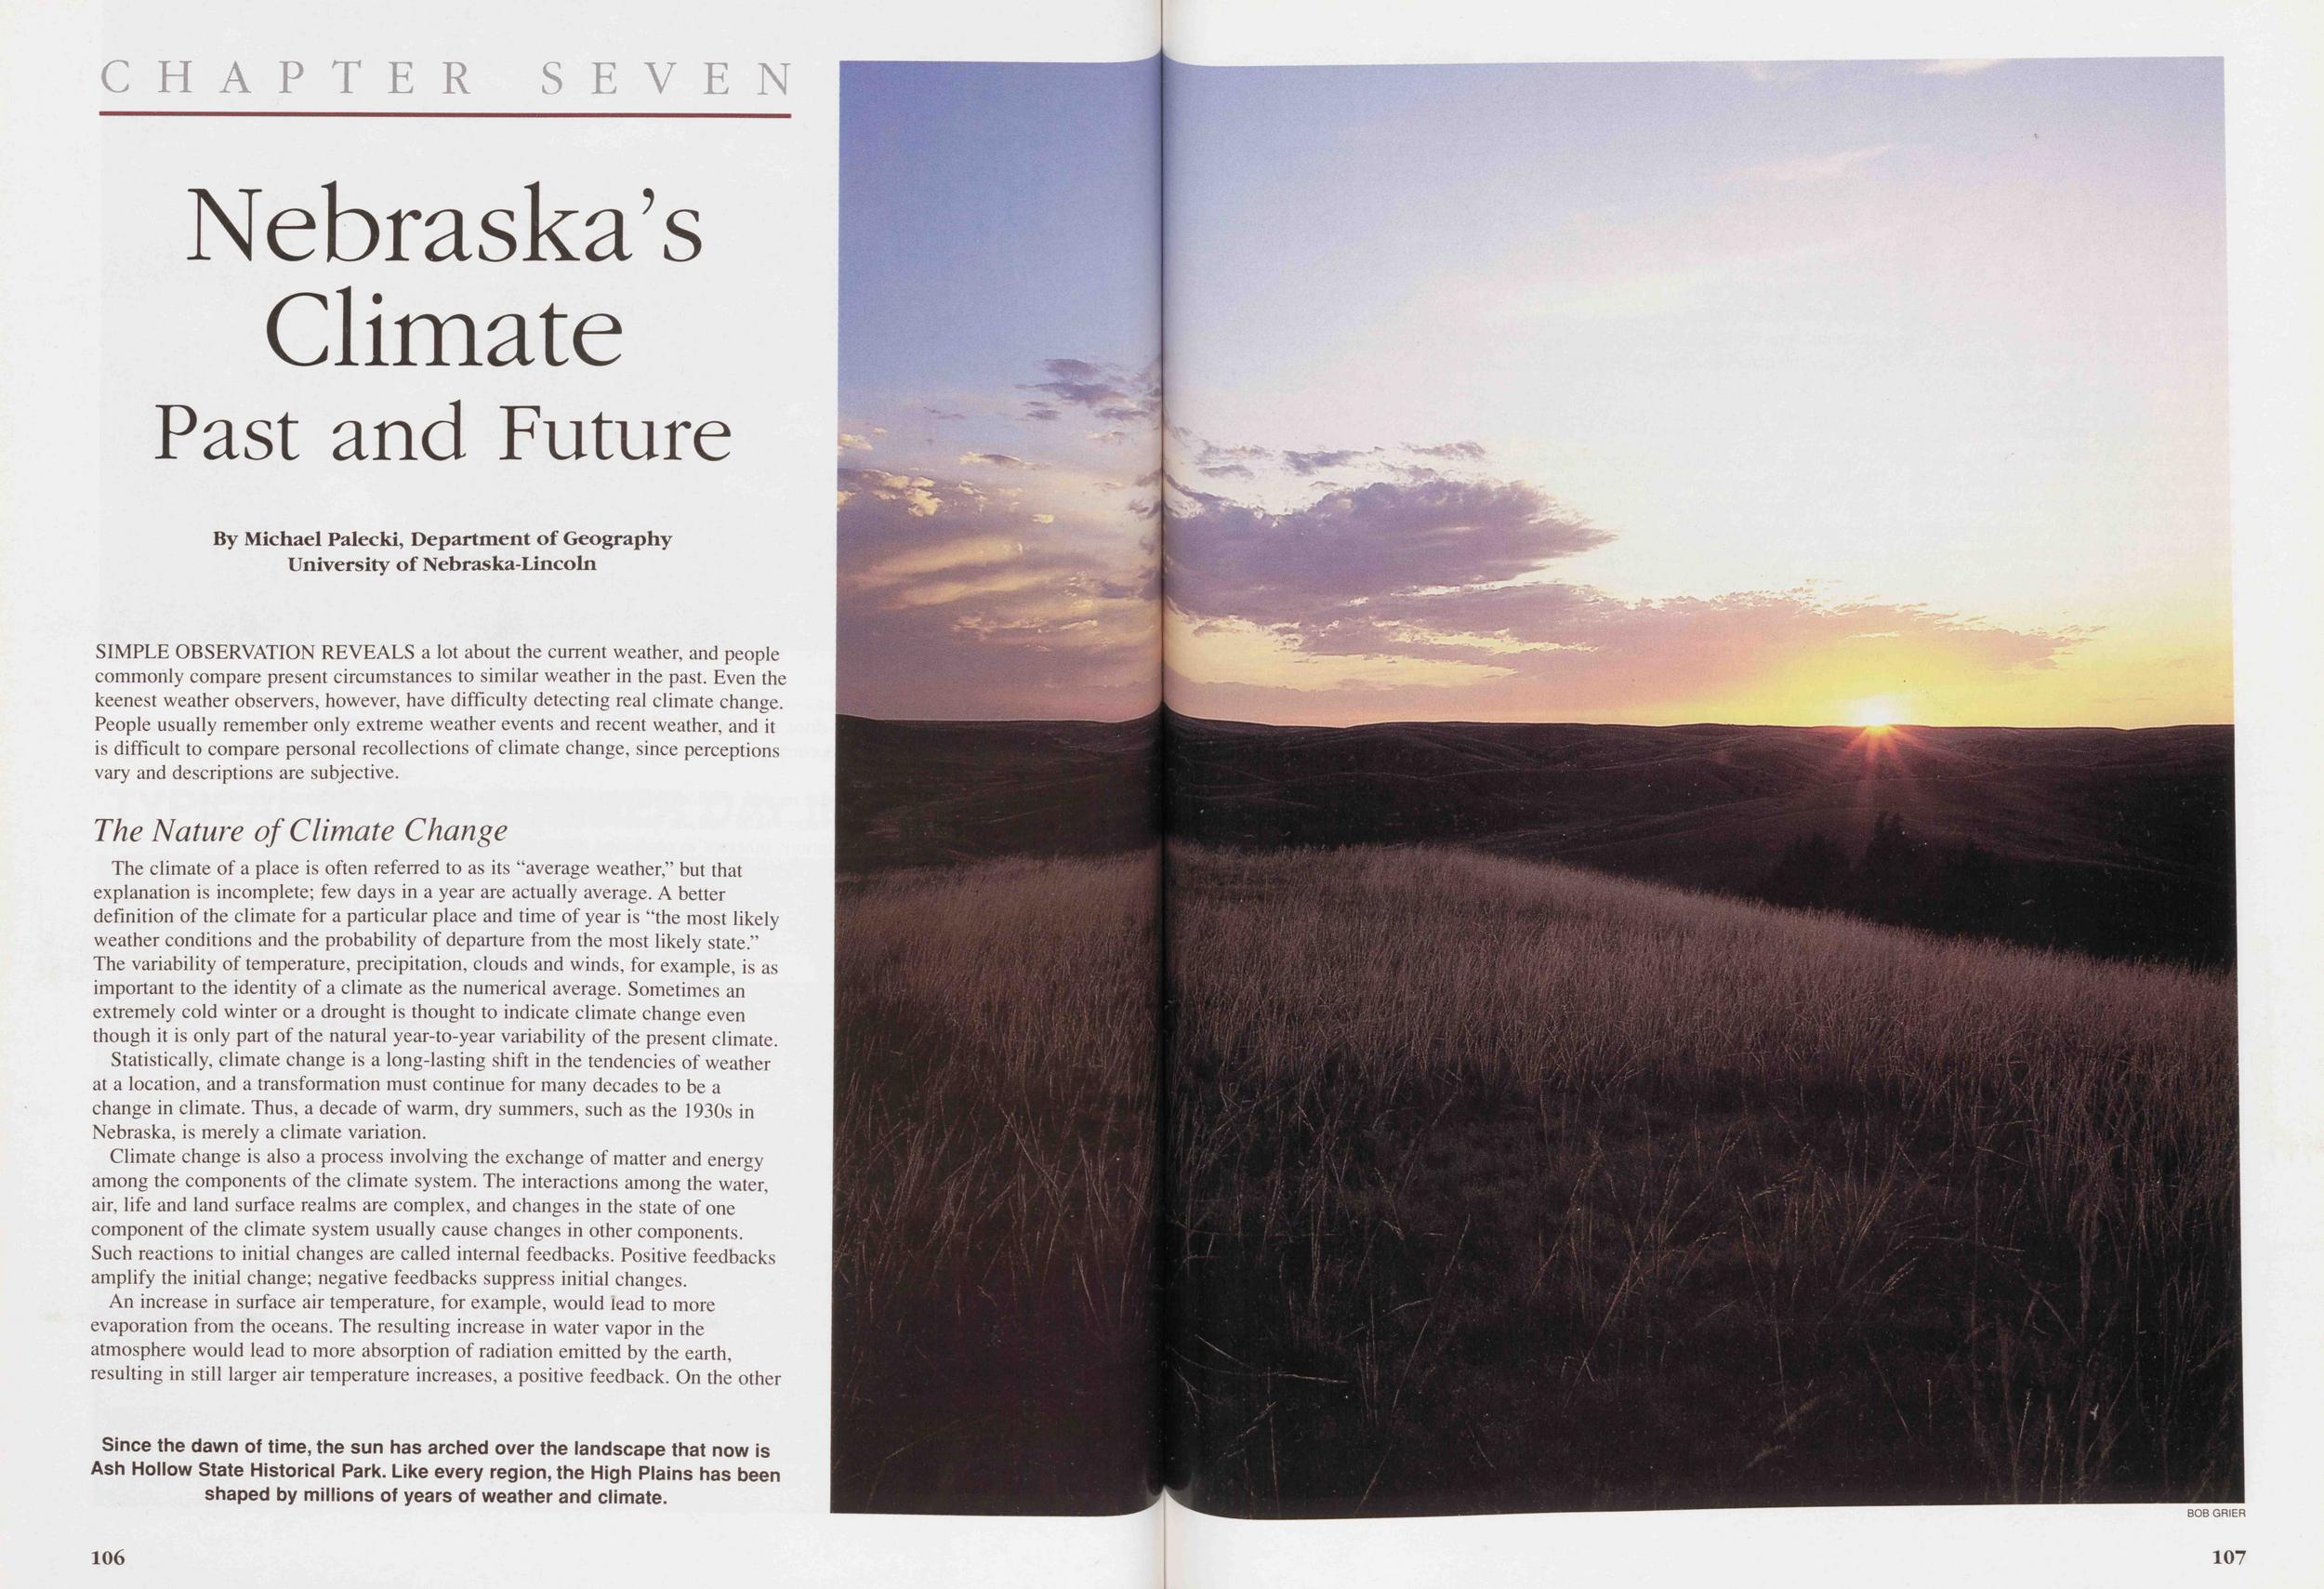
CHAPTFR Nebraska's Climate Past and Future
By Michael Palecki, Department of Geography University of Nebraska-LincolnSIMPLE OBSERVATION REVEALS a lot about the current weather, and people commonly compare present circumstances to similar weather in the past. Even the keenest weather observers, however, have difficulty detecting real climate change. People usually remember only extreme weather events and recent weather, and it is difficult to compare personal recollections of climate change, since perceptions vary and descriptions are subjective.
The Nature of Climate ChangeThe climate of a place is often referred to as its "average weather," but that explanation is incomplete; few days in a year are actually average. A better definition of the climate for a particular place and time of year is "the most likely weather conditions and the probability of departure from the most likely state." The variability of temperature, precipitation, clouds and winds, for example, is as important to the identity of a climate as the numerical average. Sometimes an extremely cold winter or a drought is thought to indicate climate change even though it is only part of the natural year-to-year variability of the present climate.
Statistically, climate change is a long-lasting shift in the tendencies of weather at a location, and a transformation must continue for many decades to be a change in climate. Thus, a decade of warm, dry summers, such as the 1930s in Nebraska, is merely a climate variation.
Climate change is also a process involving the exchange of matter and energy among the components of the climate system. The interactions among the water, air, life and land surface realms are complex, and changes in the state of one component of the climate system usually cause changes in other components. Such reactions to initial changes are called internal feedbacks. Positive feedbacks amplify the initial change; negative feedbacks suppress initial changes.
An increase in surface air temperature, for example, would lead to more evaporation from the oceans. The resulting increase in water vapor in the atmosphere would lead to more absorption of radiation emitted by the earth, resulting in still larger air temperature increases, a positive feedback. On the other 106
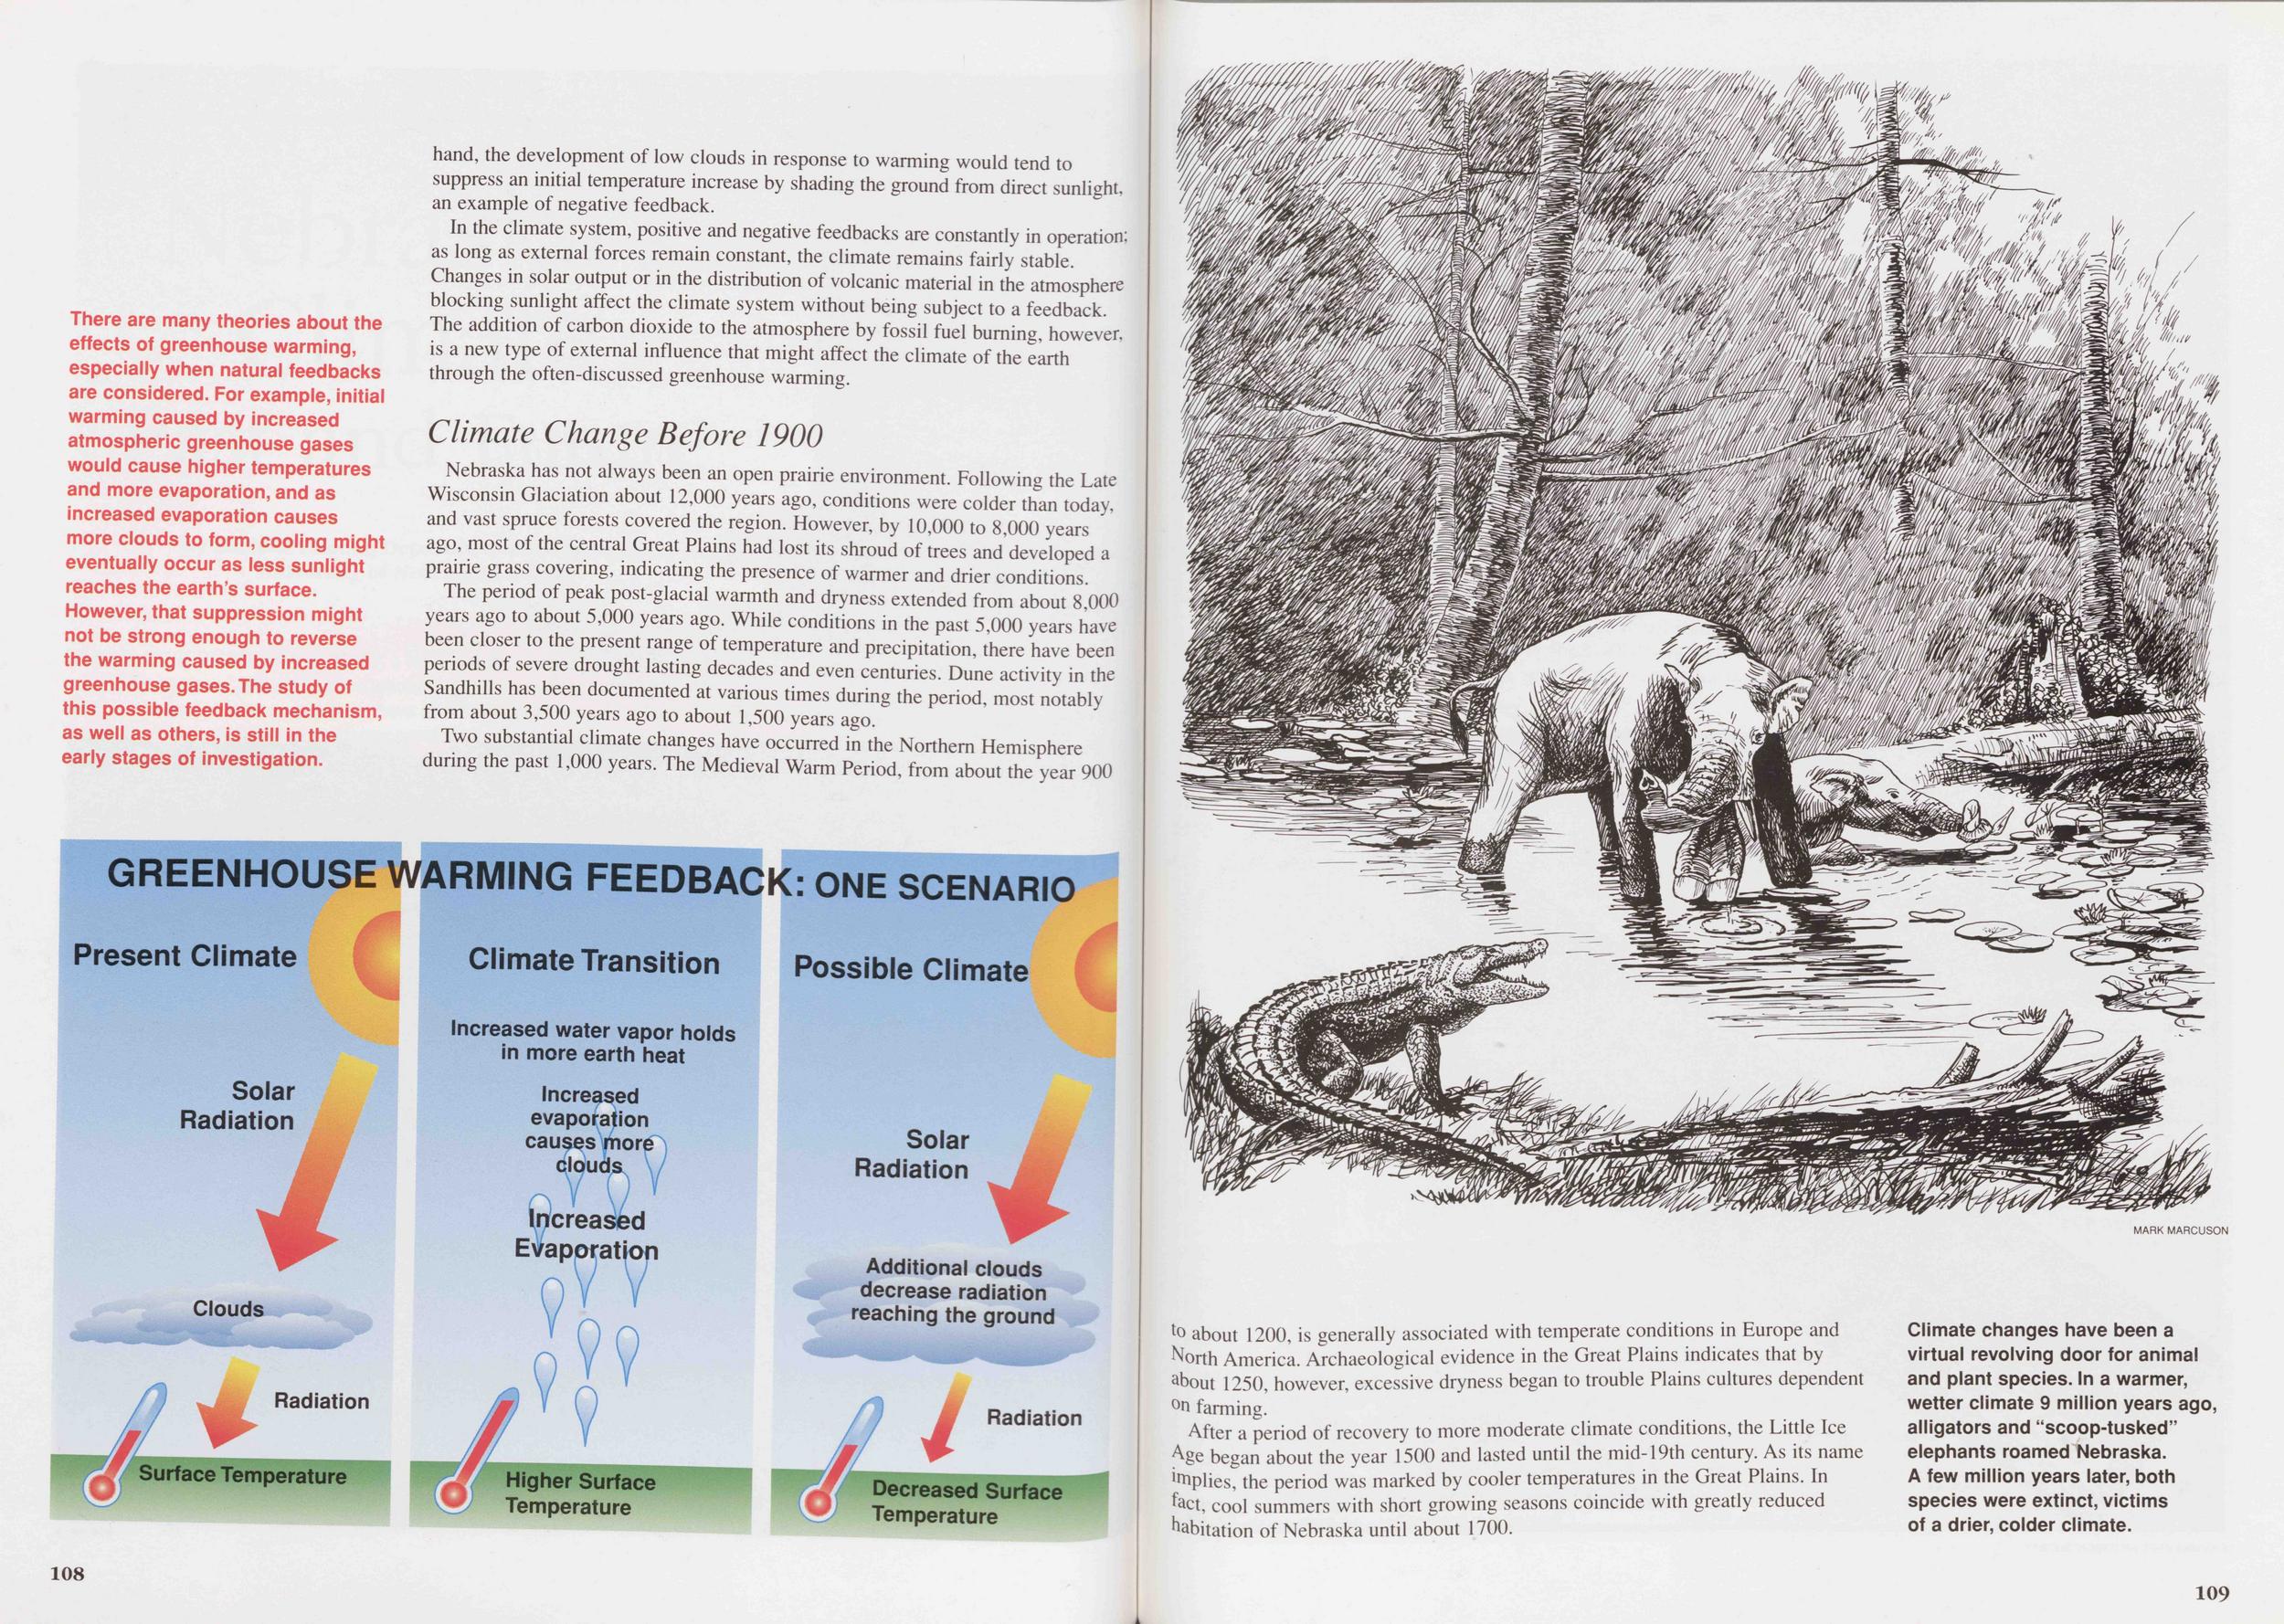
In the climate system, positive and negative feedbacks are constantly in operation; as long as external forces remain constant, the climate remains fairly stable. Changes in solar output or in the distribution of volcanic material in the atmosphere blocking sunlight affect the climate system without being subject to a feedback. The addition of carbon dioxide to the atmosphere by fossil fuel burning, however, is a new type of external influence that might affect the climate of the earth through the often-discussed greenhouse warming.
Climate Change Before 1900Nebraska has not always been an open prairie environment. Following the Late Wisconsin Glaciation about 12,000 years ago, conditions were colder than today, and vast spruce forests covered the region. However, by 10,000 to 8,000 years ago, most of the central Great Plains had lost its shroud of trees and developed a prairie grass covering, indicating the presence of warmer and drier conditions.
The period of peak post-glacial warmth and dryness extended from about 8,000 years ago to about 5,000 years ago. While conditions in the past 5,000 years have been closer to the present range of temperature and precipitation, there have been periods of severe drought lasting decades and even centuries. Dune activity in the Sandhills has been documented at various times during the period, most notably from about 3,500 years ago to about 1,500 years ago.
Two substantial climate changes have occurred in the Northern Hemisphere during the past 1,000 years. The Medieval Warm Period, from about the year 900 108
After a period of recovery to more moderate climate conditions, the Little Ice Age began about the year 1500 and lasted until the mid-19th century. As its name troplies, the period was marked by cooler temperatures in the Great Plains. In to, cool summers with short growing seasons coincide with greatly reduced habitation of Nebraska until about 1700.
109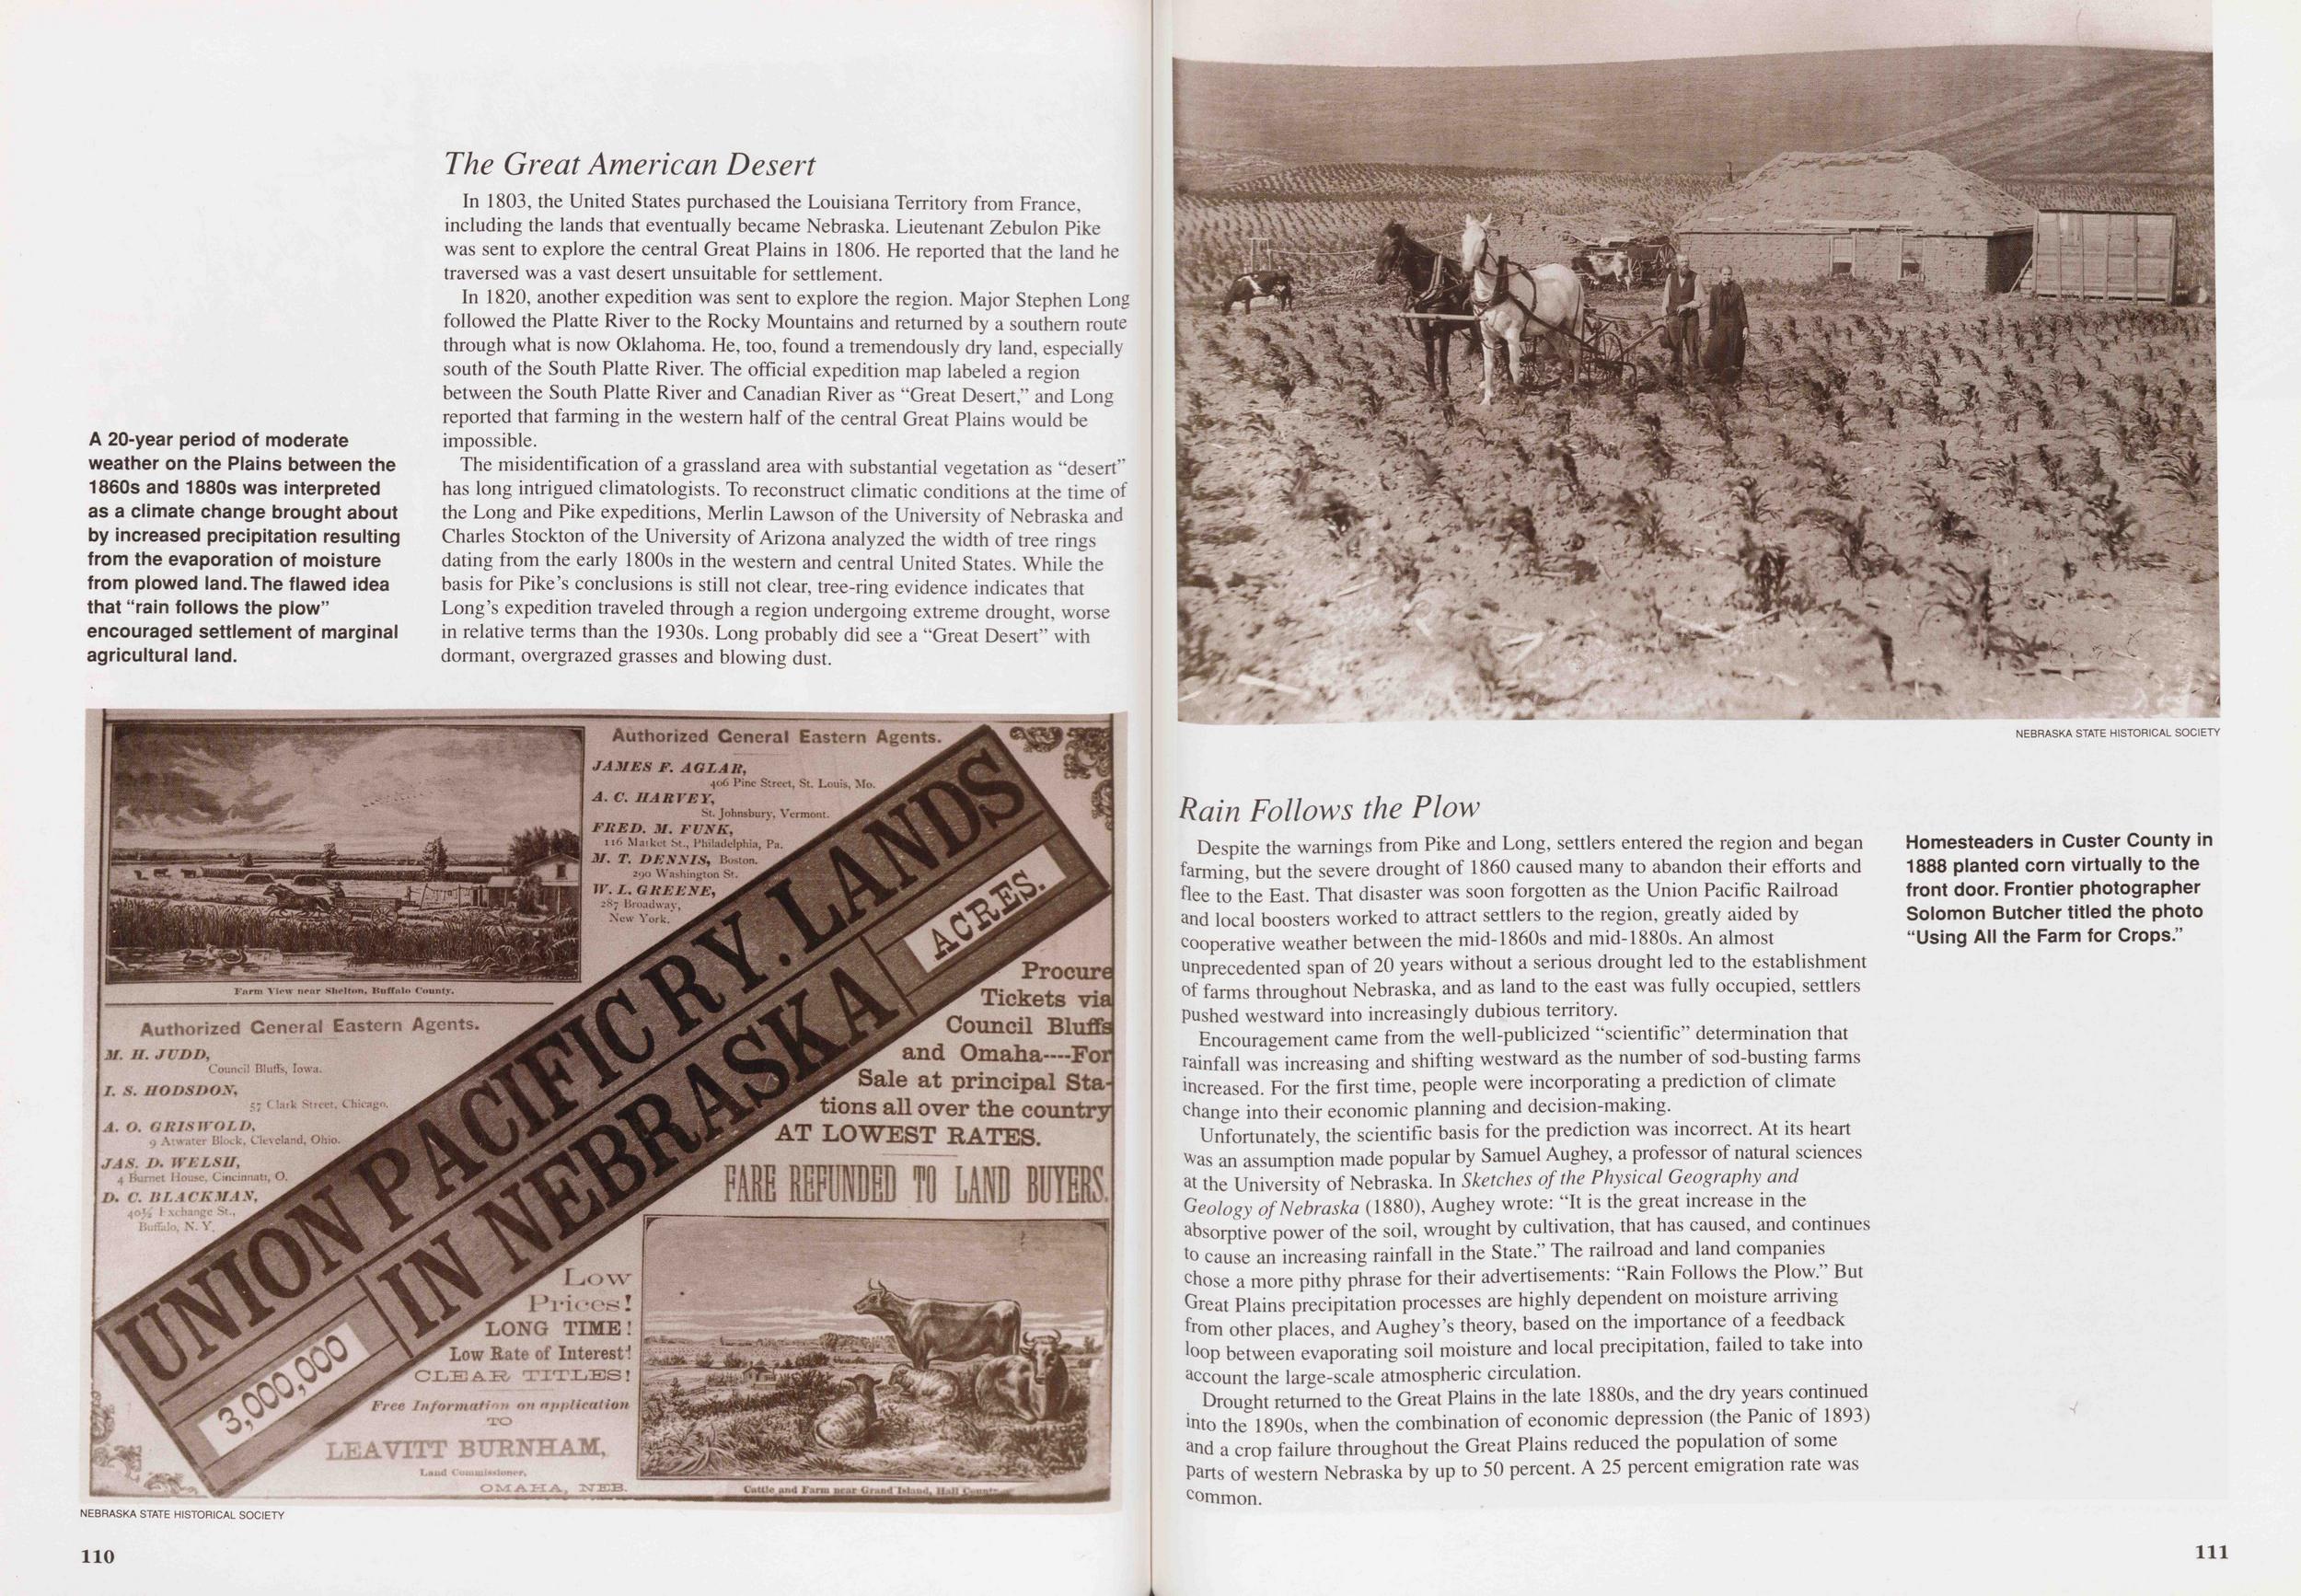
In 1803, the United States purchased the Louisiana Territory from France, including the lands that eventually became Nebraska. Lieutenant Zebulon Pike was sent to explore the central Great Plains in 1806. He reported that the land he traversed was a vast desert unsuitable for settlement.
In 1820, another expedition was sent to explore the region. Major Stephen Long followed the Platte River to the Rocky Mountains and returned by a southern route through what is now Oklahoma. He, too, found a tremendously dry land, especially south of the South Platte River. The official expedition map labeled a region between the South Platte River and Canadian River as "Great Desert," and Long reported that farming in the western half of the central Great Plains would be impossible.
The misidentification of a grassland area with substantial vegetation as "desert" has long intrigued climatologists. To reconstruct climatic conditions at the time of the Long and Pike expeditions, Merlin Lawson of the University of Nebraska and Charles Stockton of the University of Arizona analyzed the width of tree rings dating from the early 1800s in the western and central United States. While the basis for Pike's conclusions is still not clear, tree-ring evidence indicates that Long's expedition traveled through a region undergoing extreme drought, worse in relative terms than the 1930s. Long probably did see a "Great Desert" with dormant, overgrazed grasses and blowing dust.
110Despite the warnings from Pike and Long, settlers entered the region and began farming, but the severe drought of 1860 caused many to abandon their efforts and flee to the East. That disaster was soon forgotten as the Union Pacific Railroad and local boosters worked to attract settlers to the region, greatly aided by cooperative weather between the mid-1860s and mid-1880s. An almost Unprecedented span of 20 years without a serious drought led to the establishment of farms throughout Nebraska, and as land to the east was fully occupied, settlers pushed westward into increasingly dubious territory.
Encouragement came from the well-publicized "scientific" determination that rainfall was increasing and shifting westward as the number of sod-busting farms increased. For the first time, people were incorporating a prediction of climate change into their economic planning and decision-making.
Unfortunately, the scientific basis for the prediction was incorrect. At its heart vvas an assumption made popular by Samuel Aughey, a professor of natural sciences at the University of Nebraska. In Sketches of the Physical Geography and Geology of Nebraska (1880), Aughey wrote: "It is the great increase in the absorptive power of the soil, wrought by cultivation, that has caused, and continues to cause an increasing rainfall in the State." The railroad and land companies chose a more pithy phrase for their advertisements: "Rain Follows the Plow." But Great Plains precipitation processes are highly dependent on moisture arriving from other places, and Aughey's theory, based on the importance of a feedback loop between evaporating soil moisture and local precipitation, failed to take into account the large-scale atmospheric circulation.
Drought returned to the Great Plains in the late 1880s, and the dry years continued into the 1890s, when the combination of economic depression (the Panic of 1893) and a crop failure throughout the Great Plains reduced the population of some Parts of western Nebraska by up to 50 percent. A 25 percent emigration rate was common.
111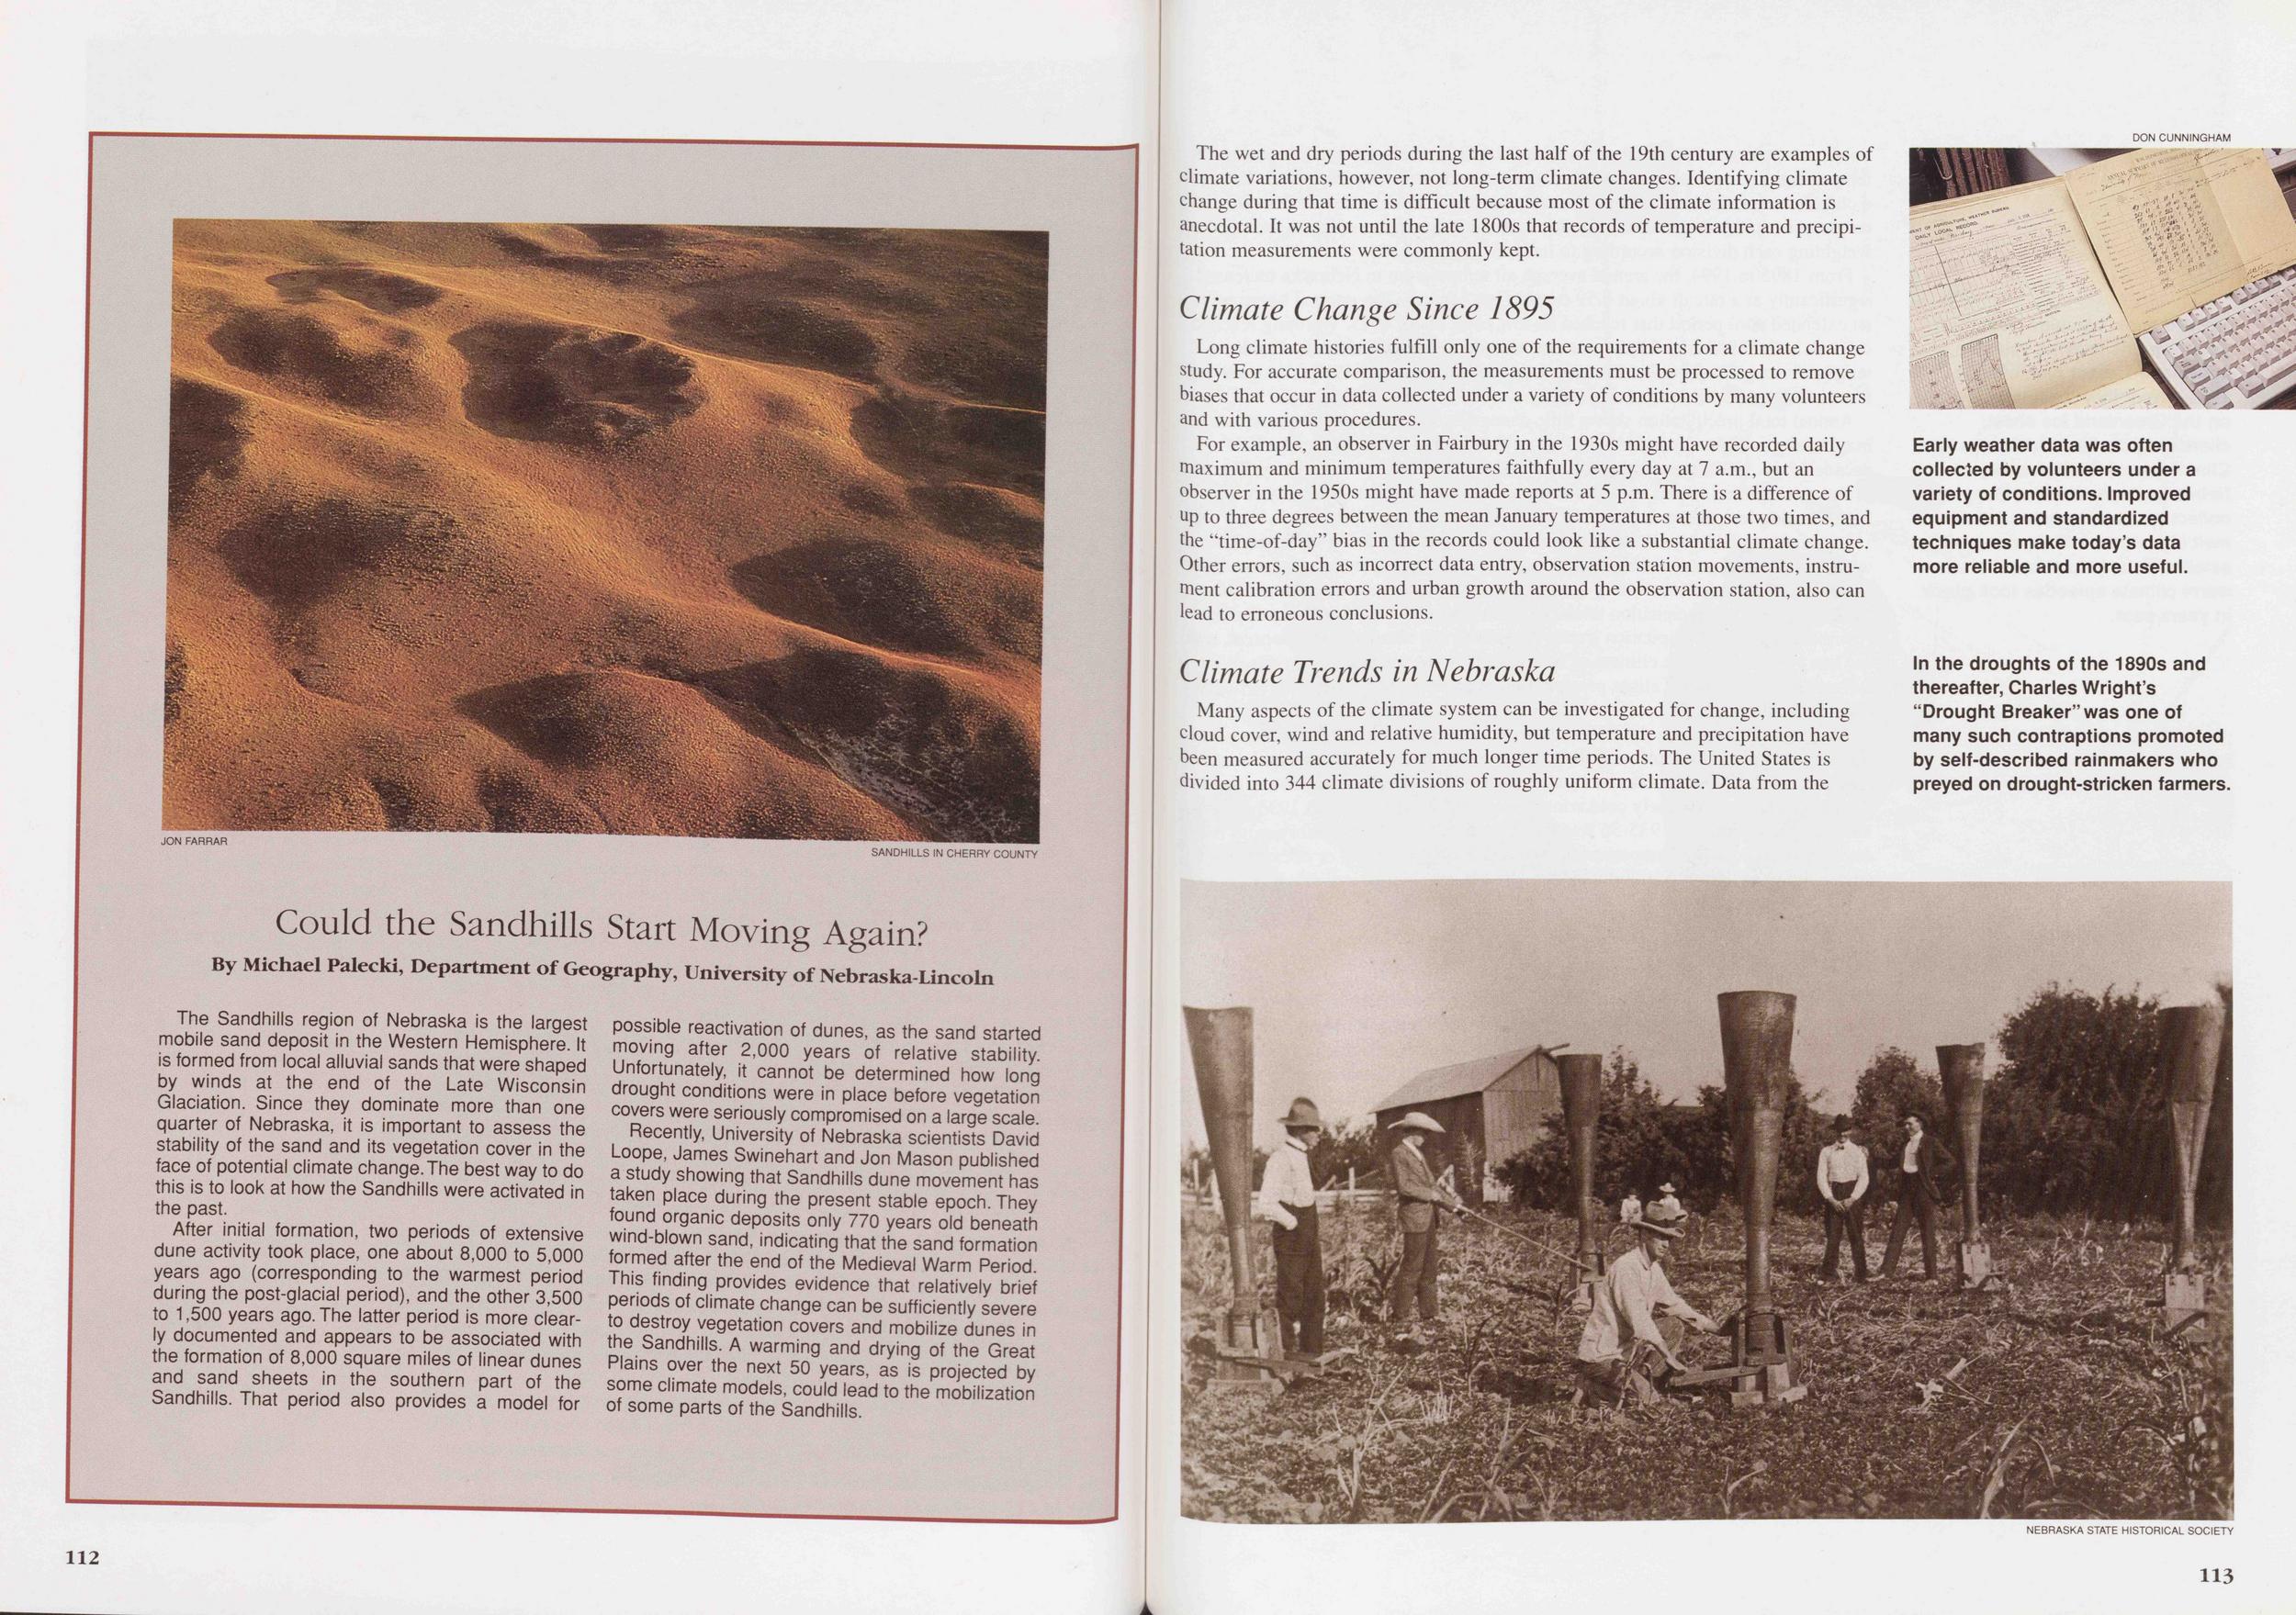
The Sandhills region of Nebraska is the largest mobile sand deposit in the Western Hemisphere. It is formed from local alluvial sands that were shaped by winds at the end of the Late Wisconsin Glaciation. Since they dominate more than one quarter of Nebraska, it is important to assess the stability of the sand and its vegetation cover in the face of potential climate change. The best way to do this is to look at how the Sandhills were activated in the past.
After initial formation, two periods of extensive dune activity took place, one about 8,000 to 5,000 years ago (corresponding to the warmest period during the post-glacial period), and the other 3,500 to 1,500 years ago. The latter period is more clearly documented and appears to be associated with the formation of 8,000 square miles of linear dunes and sand sheets in the southern part of the Sandhills. That period also provides a model for possible reactivation of dunes, as the sand started moving after 2,000 years of relative stability. Unfortunately, it cannot be determined how long drought conditions were in place before vegetation covers were seriously compromised on a large scale.
Recently, University of Nebraska scientists David Loope, James Swinehart and Jon Mason published a study showing that Sandhills dune movement has taken place during the present stable epoch. They found organic deposits only 770 years old beneath wind-blown sand, indicating that the sand formation formed after the end of the Medieval Warm Period. This finding provides evidence that relatively brief periods of climate change can be sufficiently severe to destroy vegetation covers and mobilize dunes in the Sandhills. A warming and drying of the Great Plains over the next 50 years, as is projected by some climate models, could lead to the mobilization of some parts of the Sandhills.
112The wet and dry periods during the last half of the 19th century are examples of climate variations, however, not long-term climate changes. Identifying climate change during that time is difficult because most of the climate information is anecdotal. It was not until the late 1800s that records of temperature and precipitation measurements were commonly kept.
Climate Change Since 1895Long climate histories fulfill only one of the requirements for a climate change study. For accurate comparison, the measurements must be processed to remove biases that occur in data collected under a variety of conditions by many volunteers and with various procedures.
For example, an observer in Fairbury in the 1930s might have recorded daily maximum and minimum temperatures faithfully every day at 7 a.m., but an observer in the 1950s might have made reports at 5 p.m. There is a difference of up to three degrees between the mean January temperatures at those two times, and the "time-of-day" bias in the records could look like a substantial climate change. Other errors, such as incorrect data entry, observation station movements, instrument calibration errors and urban growth around the observation station, also can lead to erroneous conclusions.
Climate Trends in NebraskaMany aspects of the climate system can be investigated for change, including cloud cover, wind and relative humidity, but temperature and precipitation have been measured accurately for much longer time periods. The United States is divided into 344 climate divisions of roughly uniform climate. Data from the
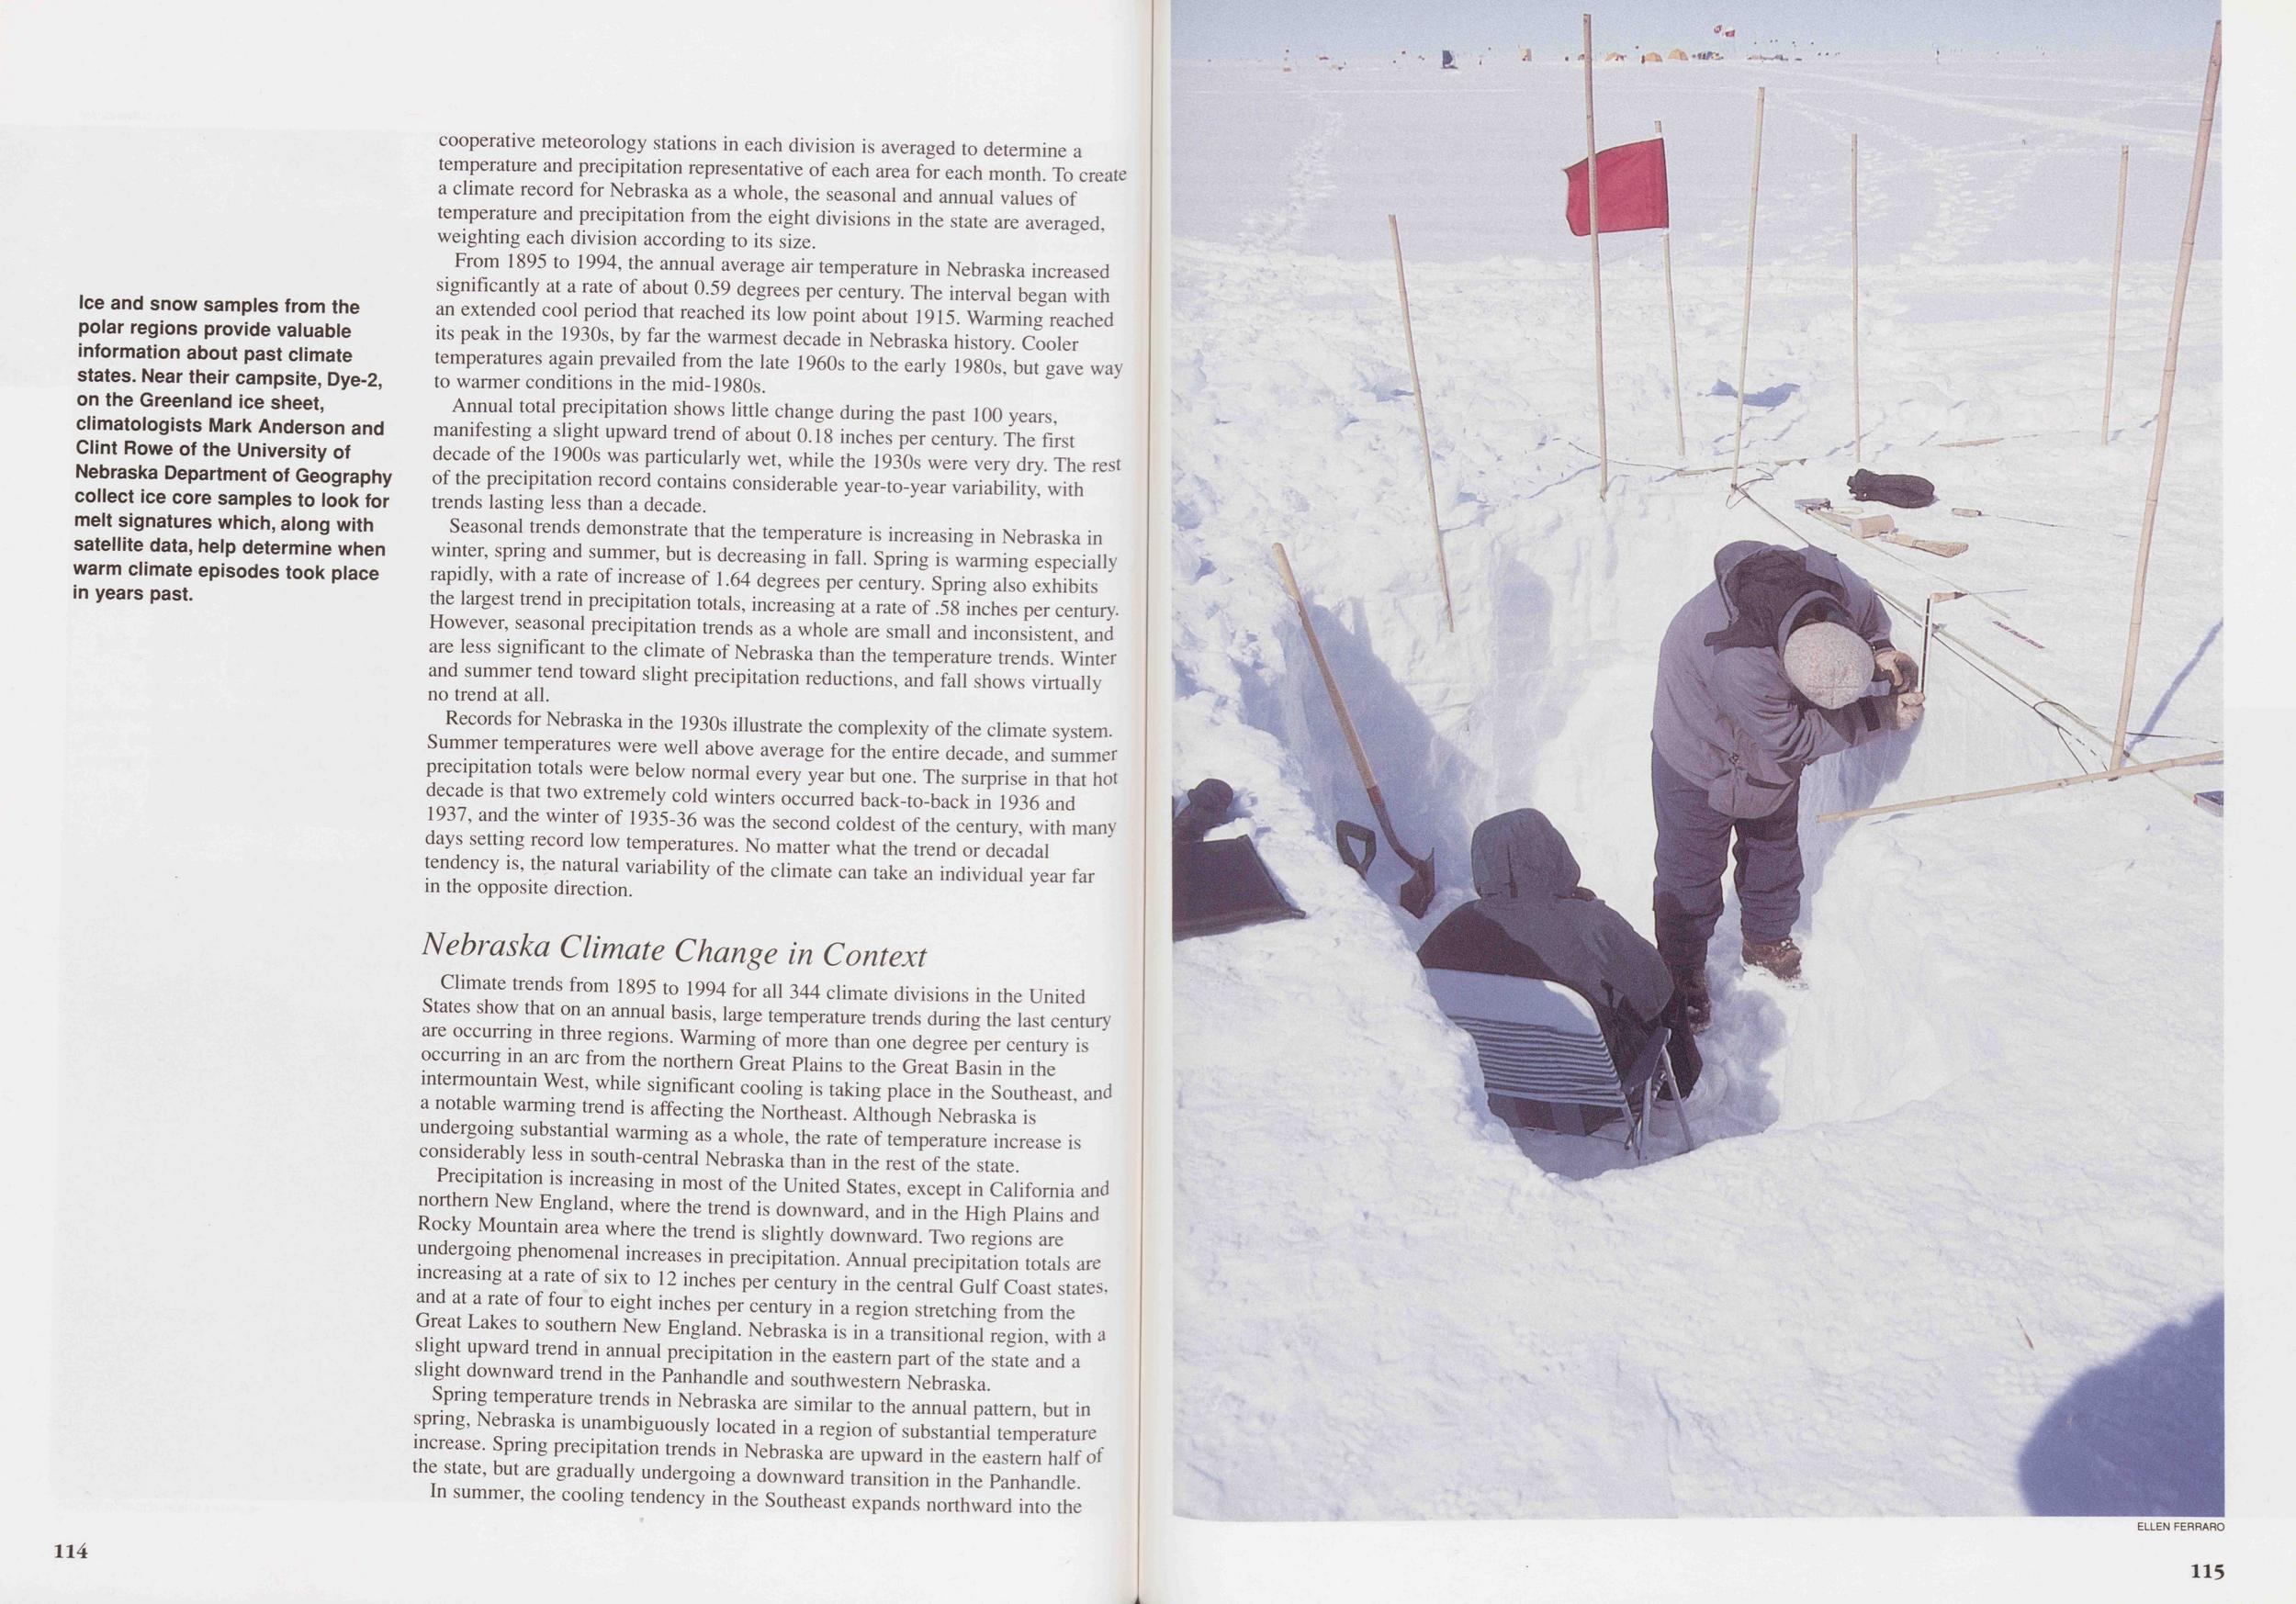 cooperative meteorology stations in each division is averaged to determine a temperature and precipitation representative of each area for each month. To create a climate record for Nebraska as a whole, the seasonal and annual values of temperature and precipitation from the eight divisions in the state are averaged, weighting each division according to its size.
From 1895 to 1994, the annual average air temperature in Nebraska increased significantly at a rate of about 0.59 degrees per century. The interval began with an extended cool period that reached its low point about 1915. Warming reached its peak in the 1930s, by far the warmest decade in Nebraska history. Cooler temperatures again prevailed from the late 1960s to the early 1980s, but gave way to warmer conditions in the mid-1980s.
Annual total precipitation shows little change during the past 100 years, manifesting a slight upward trend of about 0.18 inches per century. The first decade of the 1900s was particularly wet, while the 1930s were very dry. The rest of the precipitation record contains considerable year-to-year variability, with trends lasting less than a decade.
Seasonal trends demonstrate that the temperature is increasing in Nebraska in winter, spring and summer, but is decreasing in fall. Spring is wanning especially rapidly, with a rate of increase of 1.64 degrees per century. Spring also exhibits the largest trend in precipitation totals, increasing at a rate of .58 inches per century. However, seasonal precipitation trends as a whole are small and inconsistent, and are less significant to the climate of Nebraska than the temperature trends. Winter and summer tend toward slight precipitation reductions, and fall shows virtually no trend at all.
Records for Nebraska in the 1930s illustrate the complexity of the climate system. Summer temperatures were well above average for the entire decade, and summer precipitation totals were below normal every year but one. The surprise in that hot decade is that two extremely cold winters occurred back-to-back in 1936 and 1937, and the winter of 1935-36 was the second coldest of the century, with many days setting record low temperatures. No matter what the trend or decadal tendency is, the natural variability of the climate can take an individual year far in the opposite direction.
Nebraska Climate Change in ContextClimate trends from 1895 to 1994 for all 344 climate divisions in the United States show that on an annual basis, large temperature trends during the last century are occurring in three regions. Warming of more than one degree per century is occurring in an arc from the northern Great Plains to the Great Basin in the intermountain West, while significant cooling is taking place in the Southeast, and a notable warming trend is affecting the Northeast. Although Nebraska is undergoing substantial warming as a whole, the rate of temperature increase is considerably less in south-central Nebraska than in the rest of the state.
Precipitation is increasing in most of the United States, except in California and northern New England, where the trend is downward, and in the High Plains and Rocky Mountain area where the trend is slightly downward. Two regions are undergoing phenomenal increases in precipitation. Annual precipitation totals are increasing at a rate of six to 12 inches per century in the central Gulf Coast states, and at a rate of four to eight inches per century in a region stretching from the Great Lakes to southern New England. Nebraska is in a transitional region, with a slight upward trend in annual precipitation in the eastern part of the state and a slight downward trend in the Panhandle and southwestern Nebraska.
Spring temperature trends in Nebraska are similar to the annual pattern, but in spring, Nebraska is unambiguously located in a region of substantial temperature increase. Spring precipitation trends in Nebraska are upward in the eastern half of the state, but are gradually undergoing a downward transition in the Panhandle.
In summer, the cooling tendency in the Southeast expands northward into the 114
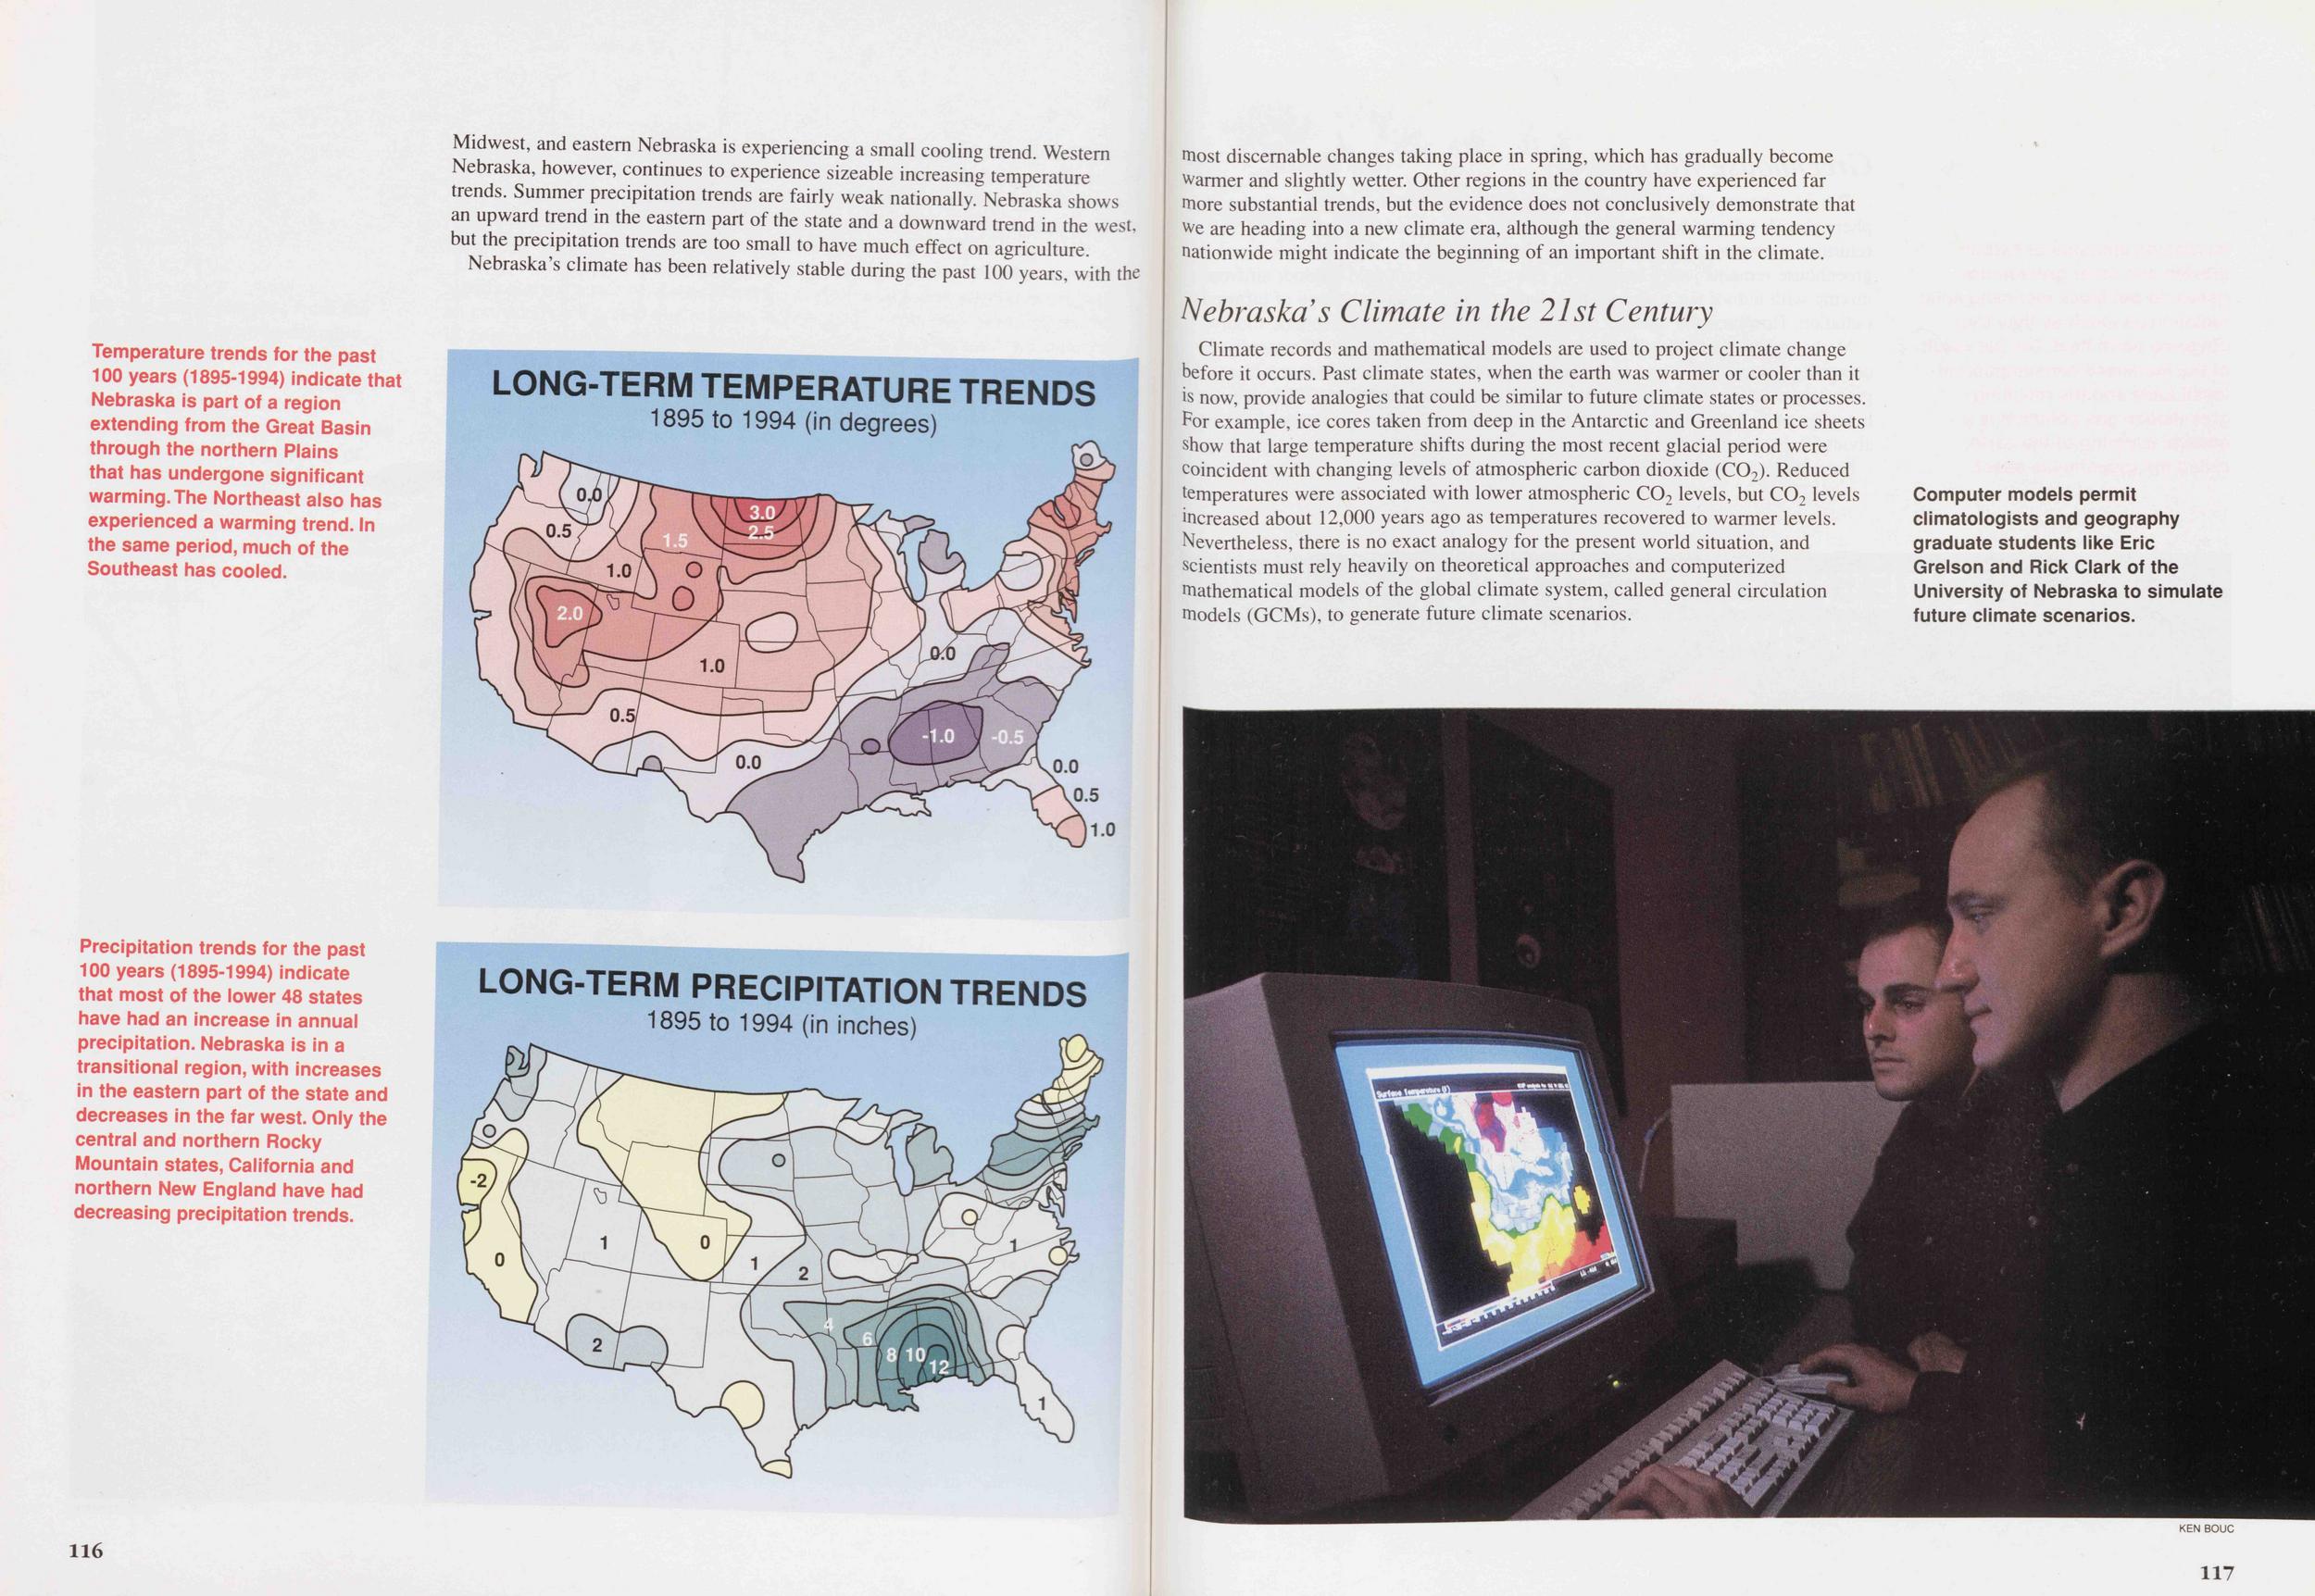
Nebraska's climate has been relatively stable during the past 100 years, with the 116 most discernible changes taking place in spring, which has gradually become Warmer and slightly wetter. Other regions in the country have experienced far more substantial trends, but the evidence does not conclusively demonstrate that we are heading into a new climate era, although the general warming tendency nationwide might indicate the beginning of an important shift in the climate.
Nebraska's Climate in the 21st CenturyClimate records and mathematical models are used to project climate change before it occurs. Past climate states, when the earth was warmer or cooler than it is now, provide analogies that could be similar to future climate states or processes. For example, ice cores taken from deep in the Antarctic and Greenland ice sheets show that large temperature shifts during the most recent glacial period were coincident with changing levels of atmospheric carbon dioxide (C02). Reduced temperatures were associated with lower atmospheric C02 levels, but C02 levels increased about 12,000 years ago as temperatures recovered to warmer levels. Nevertheless, there is no exact analogy for the present world situation, and scientists must rely heavily on theoretical approaches and computerized mathematical models of the global climate system, called general circulation models (GCMs), to generate future climate scenarios.
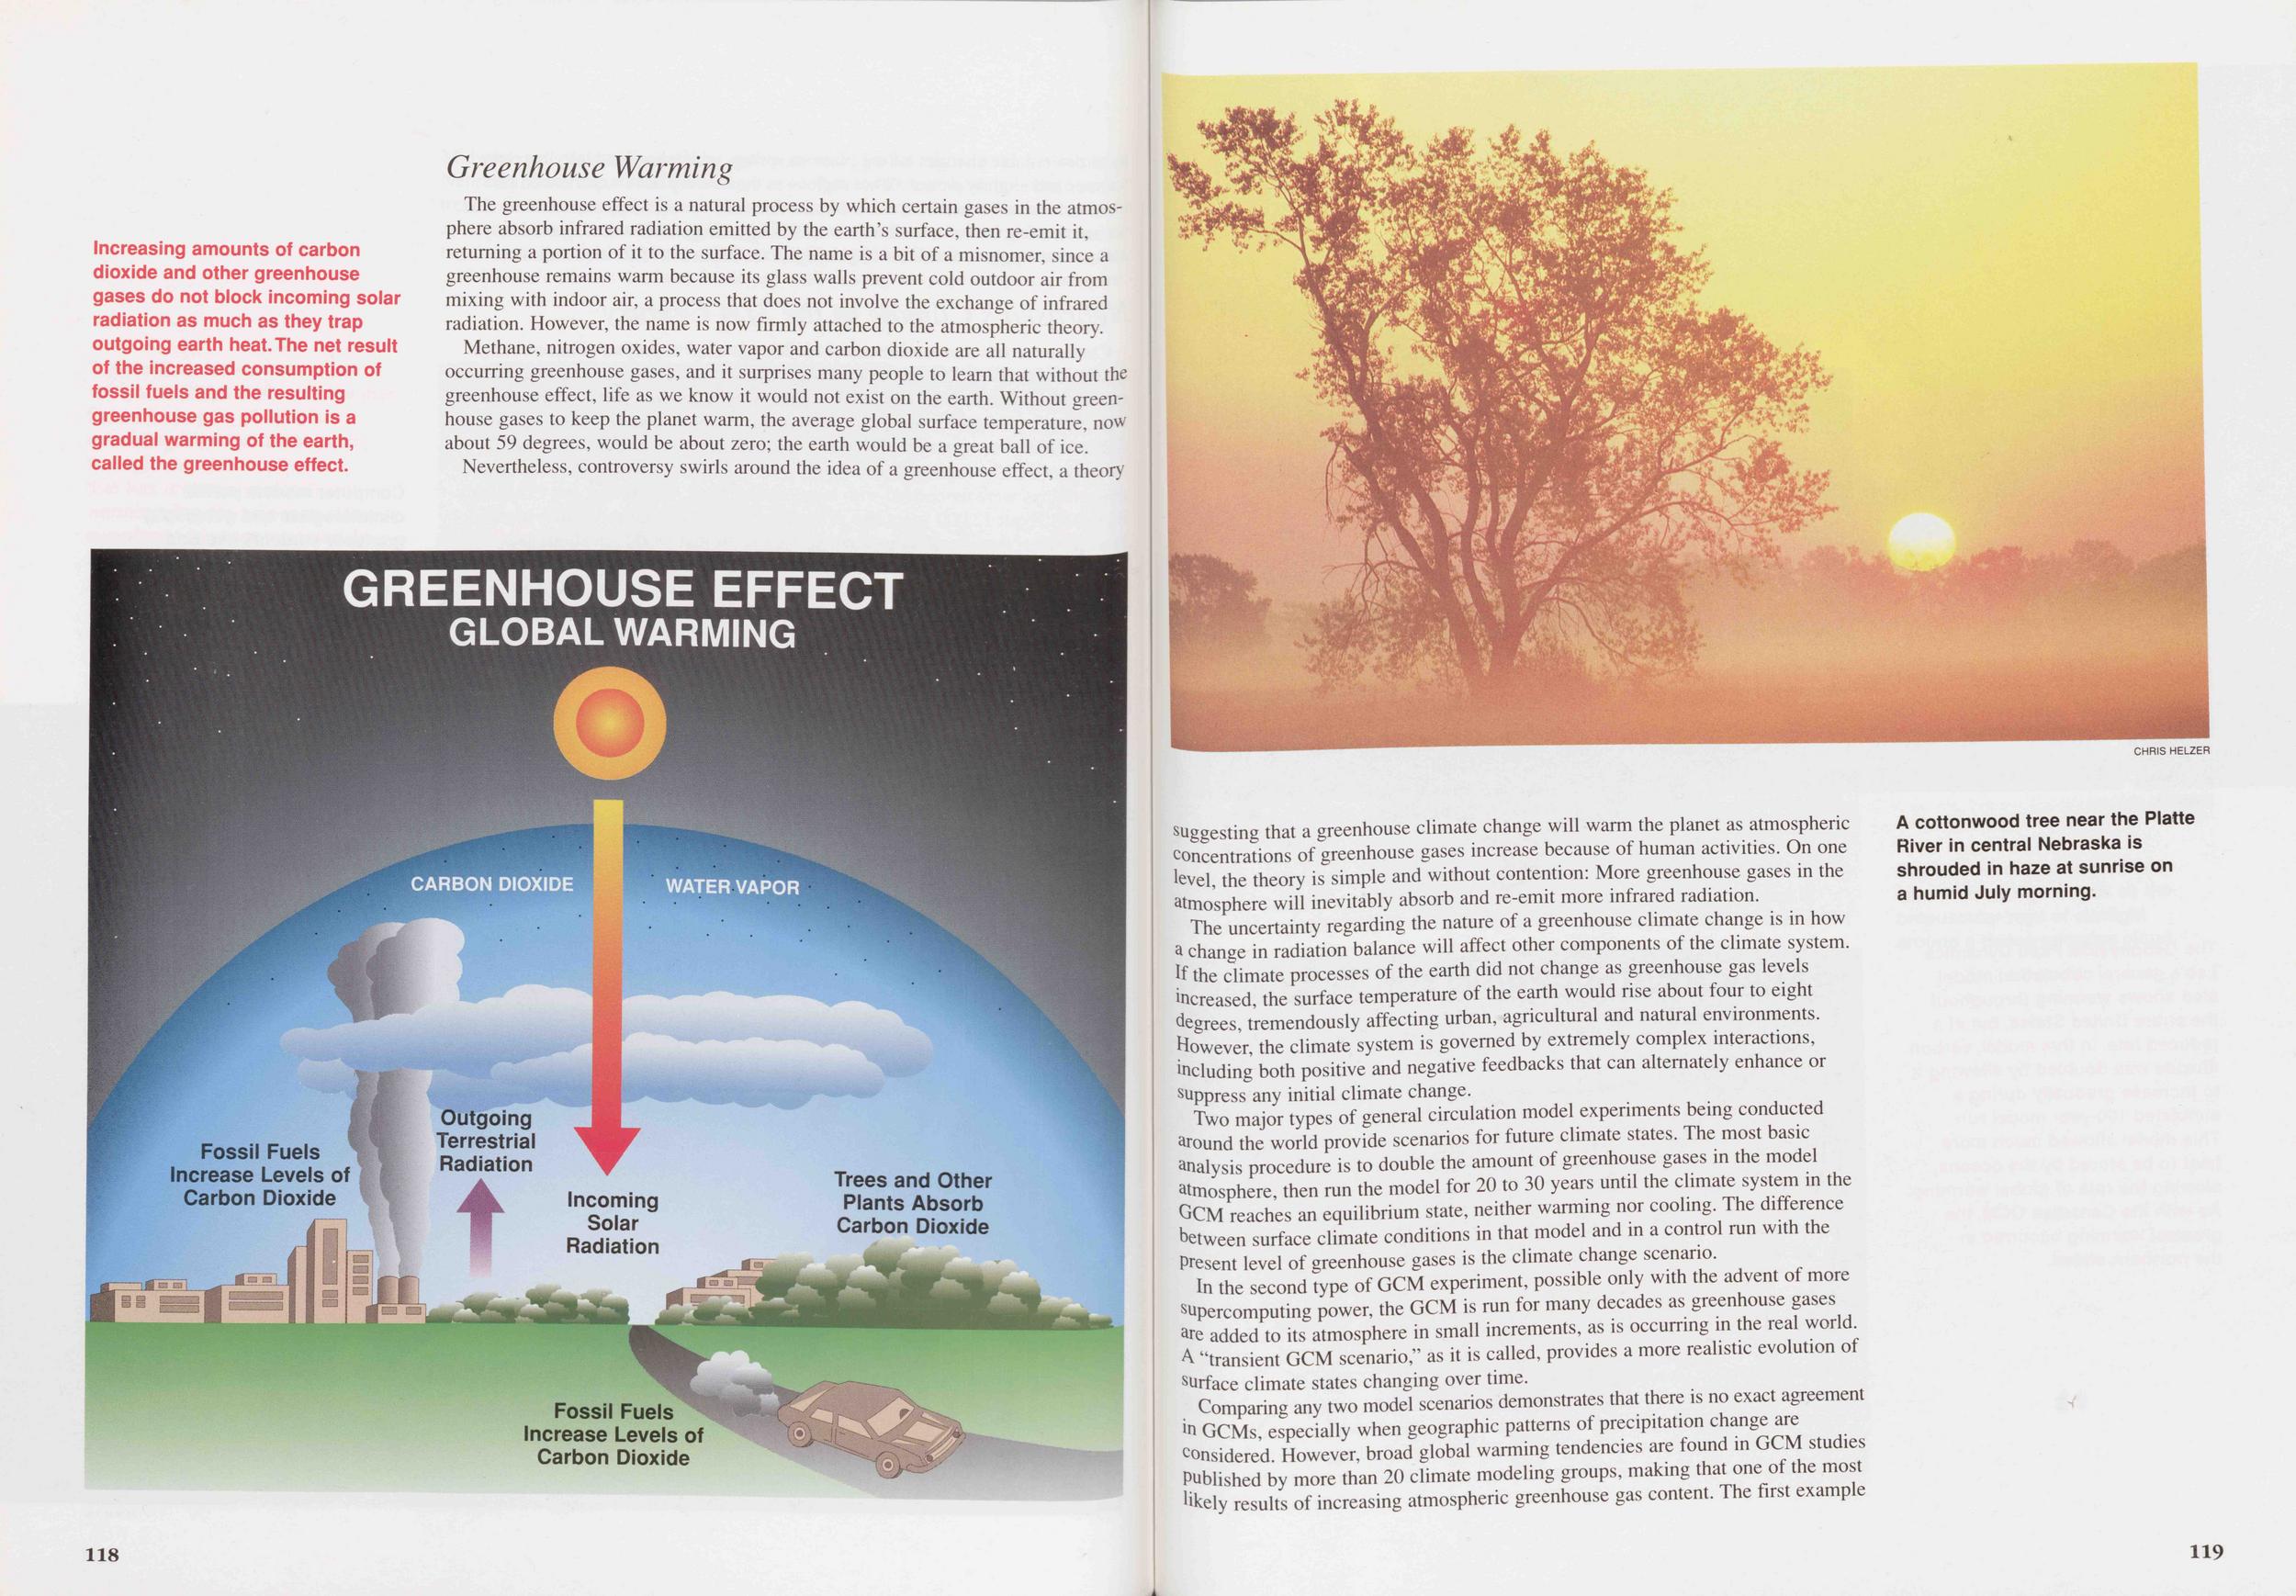 Greenhouse Warming
The greenhouse effect is a natural process by which certain gases in the atmosphere absorb infrared radiation emitted by the earth's surface, then re-emit it, returning a portion of it to the surface. The name is a bit of a misnomer, since a greenhouse remains warm because its glass walls prevent cold outdoor air from mixing with indoor air, a process that does not involve the exchange of infrared radiation. However, the name is now firmly attached to the atmospheric theory.
Methane, nitrogen oxides, water vapor and carbon dioxide are all naturally occurring greenhouse gases, and it surprises many people to learn that without the greenhouse effect, life as we know it would not exist on the earth. Without greenhouse gases to keep the planet warm, the average global surface temperature, now about 59 degrees, would be about zero; the earth would be a great ball of ice.
Nevertheless, controversy swirls around the idea of a greenhouse effect, a theory 118 suggesting that a greenhouse climate change will warm the planet as atmospheric concentrations of greenhouse gases increase because of human activities. On one level, the theory is simple and without contention: More greenhouse gases in the atmosphere will inevitably absorb and re-emit more infrared radiation.
The uncertainty regarding the nature of a greenhouse climate change is in how a change in radiation balance will affect other components of the climate system. If the climate processes of the earth did not change as greenhouse gas levels increased the surface temperature of the earth would rise about four to eight degrees tremendously affecting urban, agricultural and natural environments. However the climate system is governed by extremely complex interactions, including both positive and negative feedbacks that can alternately enhance or suppress any initial climate change.
Two major types of general circulation model experiments being conducted around the world provide scenarios for future climate states. The most basic analysis procedure is to double the amount of greenhouse gases in the model atmosphere, then run the model for 20 to 30 years until the climate system in the GCM reaches an equilibrium state, neither warming nor cooling. The difference between surface climate conditions in that model and in a control run with the Present level of greenhouse gases is the climate change scenario.
In the second type of GCM experiment, possible only with the advent of more supercomputing power, the GCM is run for many decades as greenhouse gases are added to its atmosphere in small increments, as is occurring in the real world A "transient GCM scenario," as it is called, provides a more realistic evolution of surface climate states changing over time.
Comparing any two model scenarios demonstrates that there is no exact agreement 'n GCMs, especially when geographic patterns of precipitation change are considered. However, broad global warming tendencies are found in GCM studies Published by more than 20 climate modeling groups, making that one of the most likely results of increasing atmospheric greenhouse gas content. The first example
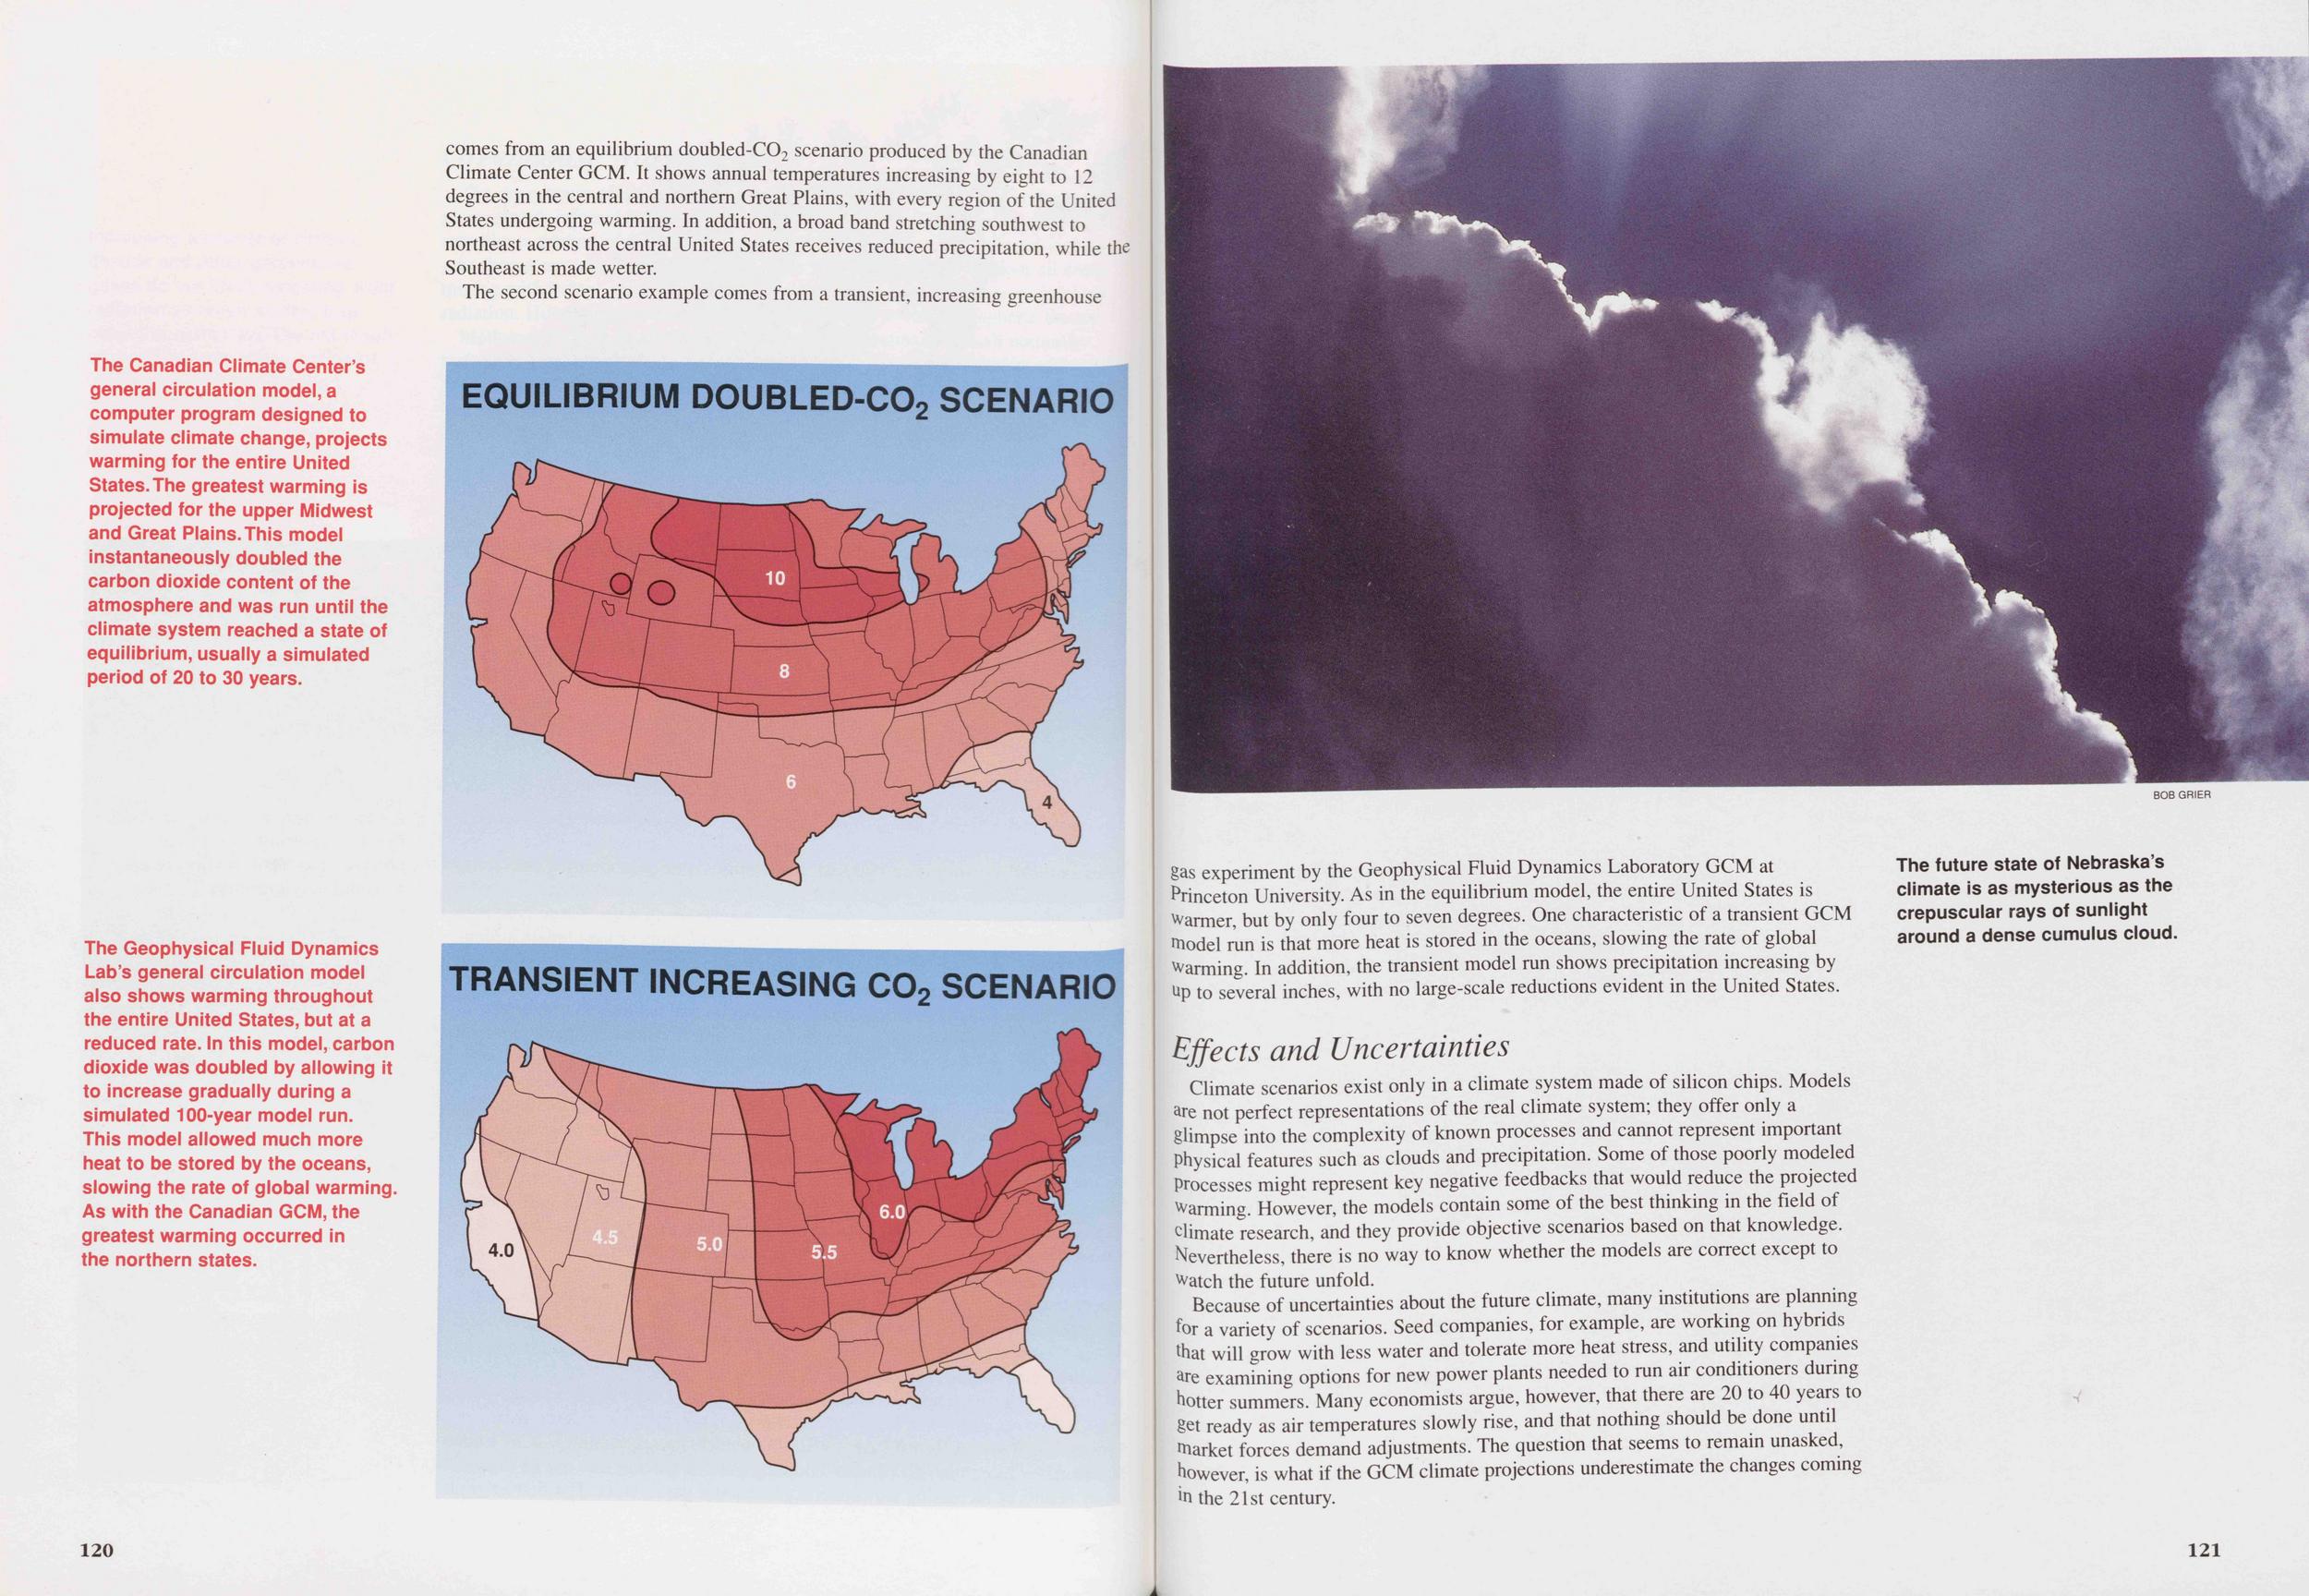
The second scenario example comes from a transient, increasing greenhouse 120
Effects and Uncertainties
Climate scenarios exist only in a climate system made of silicon chips. Models ure not perfect representations of the real climate system; they offer only a glimpse into the complexity of known processes and cannot represent important Physical features such as clouds and precipitation. Some of those poorly modeled Processes might represent key negative feedbacks that would reduce the projected Warming. However, the models contain some of the best thinking in the field of climate research, and they provide objective scenarios based on that knowledge. Nevertheless, there is no way to know whether the models are correct except to Watch the future unfold.
Because of uncertainties about the future climate, many institutions are planning for a variety of scenarios. Seed companies, for example, are working on hybrids that will grow with less water and tolerate more heat stress, and utility companies are examining options for new power plants needed to run air conditioners during hotter summers. Many economists argue, however, that there are 20 to 40 years to get ready as air temperatures slowly rise, and that nothing should be done until Market forces demand adjustments. The question that seems to remain unasked, however, is what if the GCM climate projections underestimate the changes coming to the 21st century.
Almanac
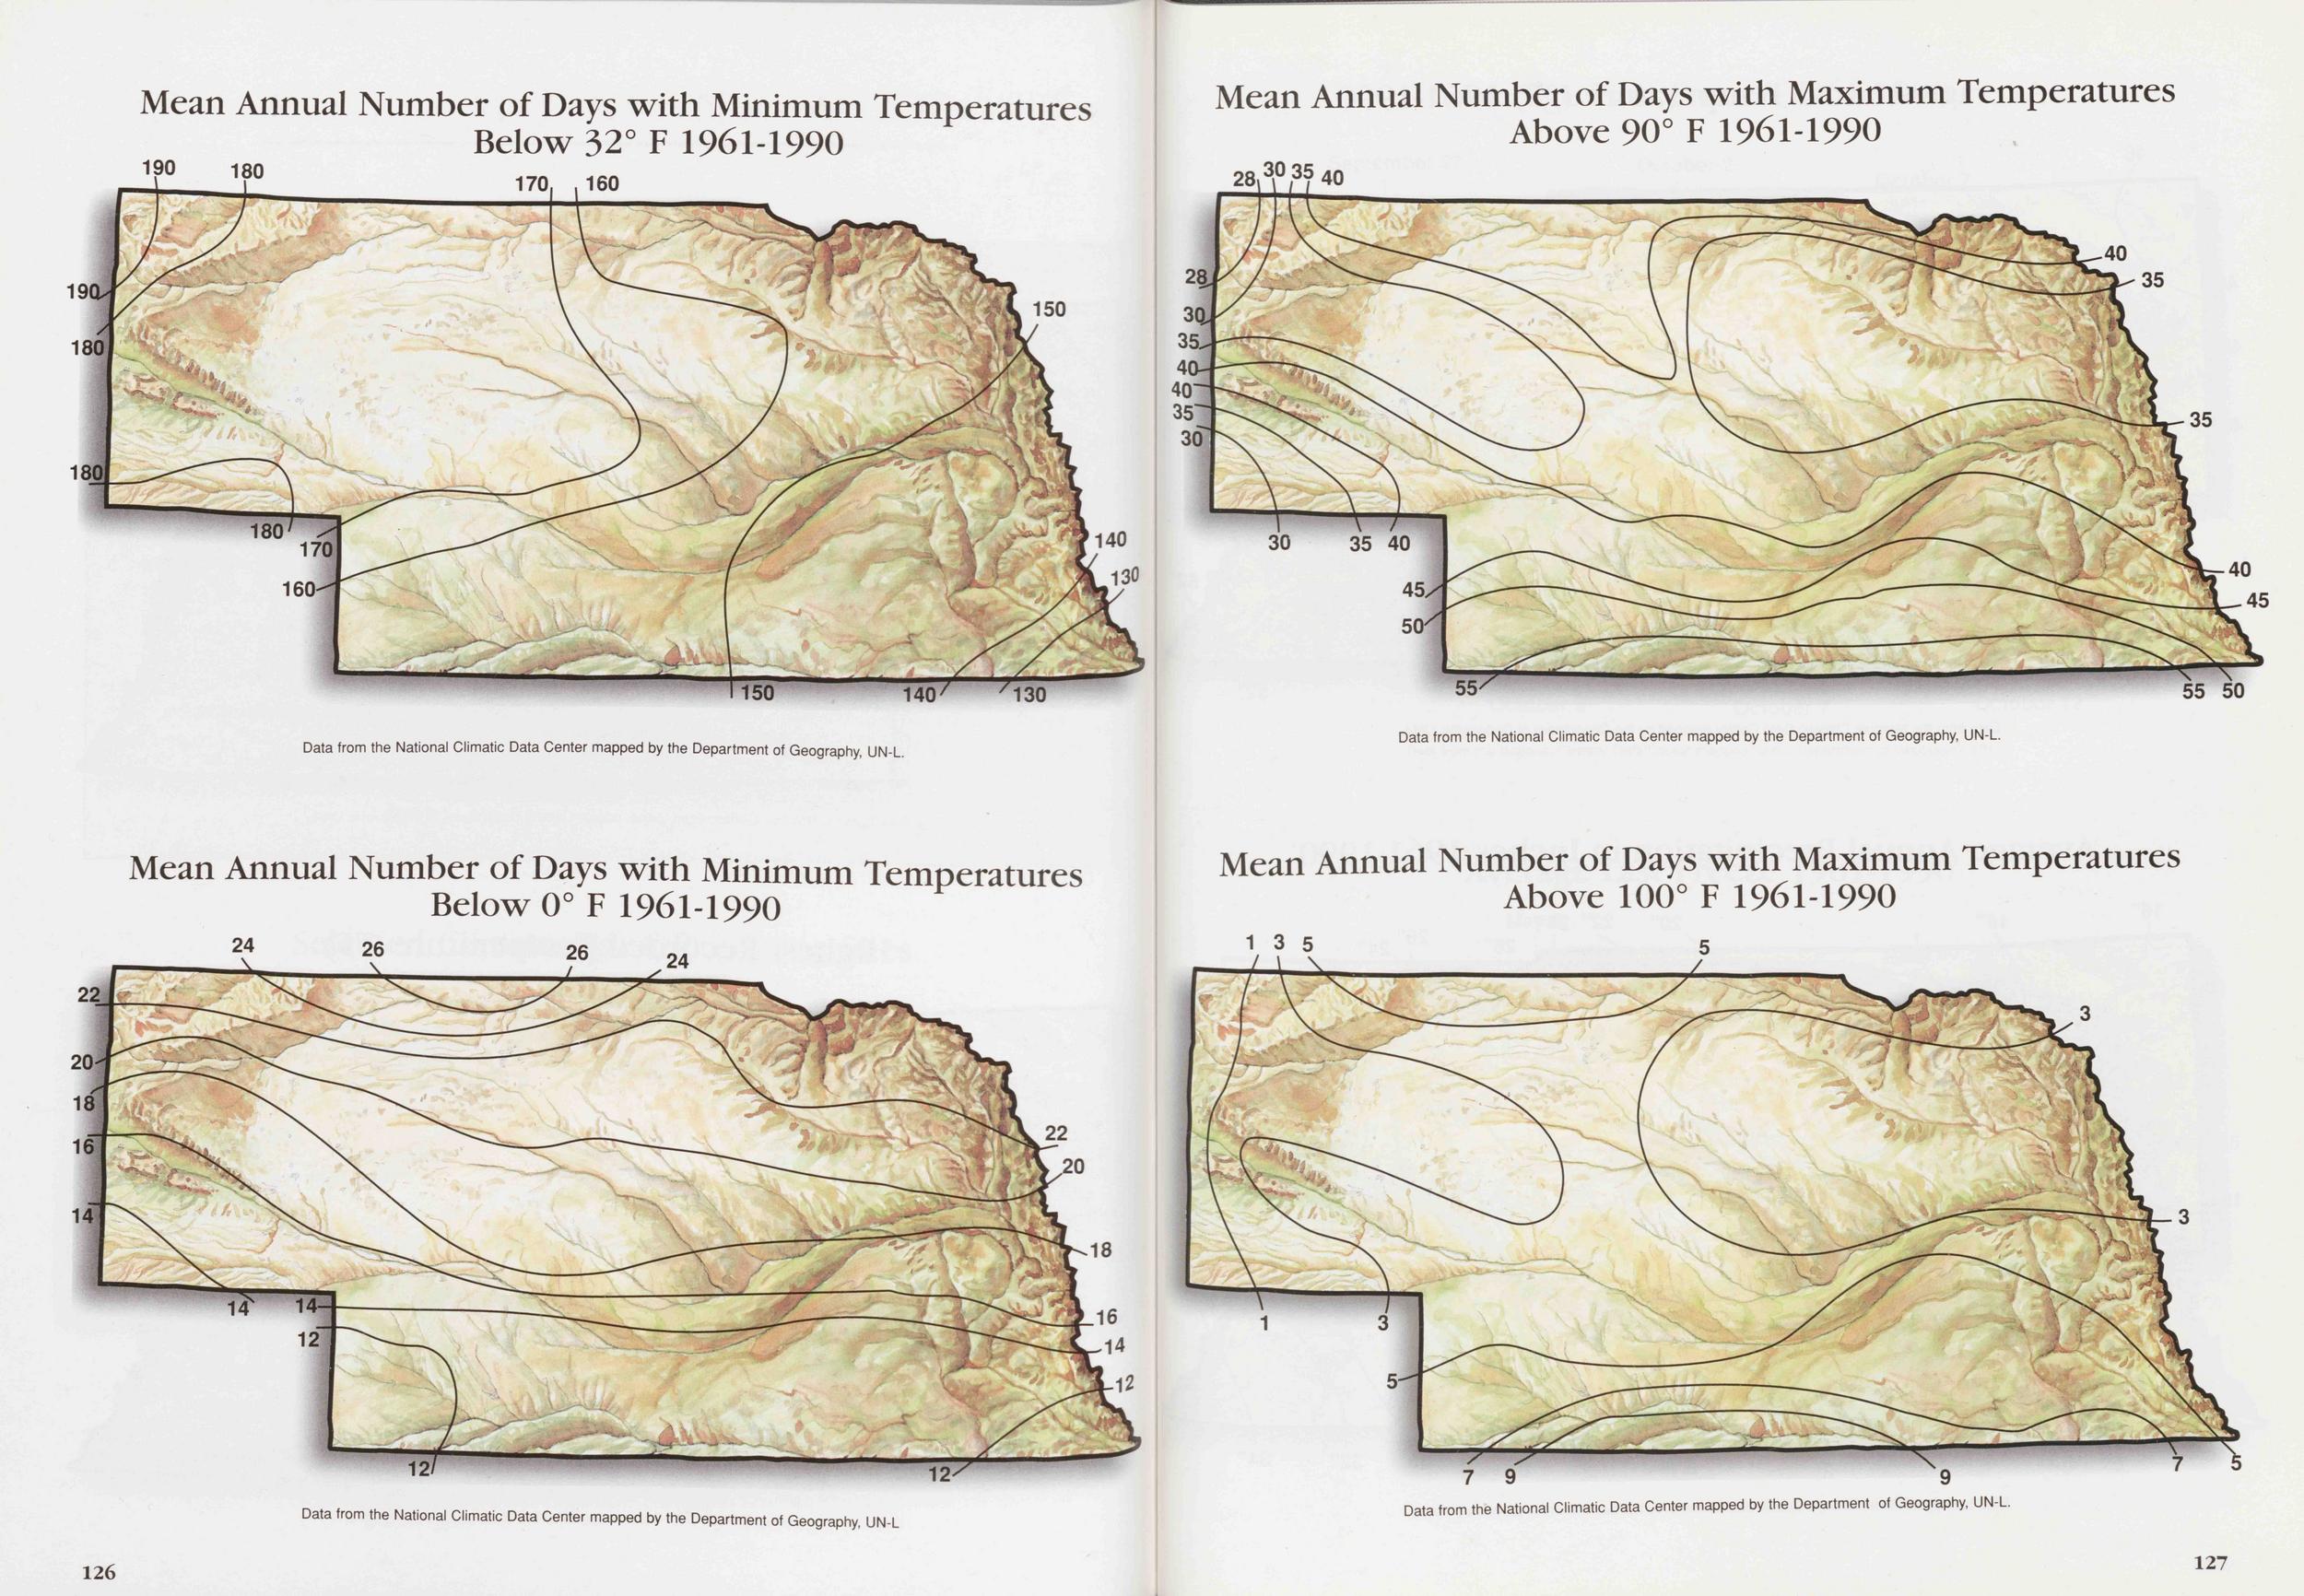
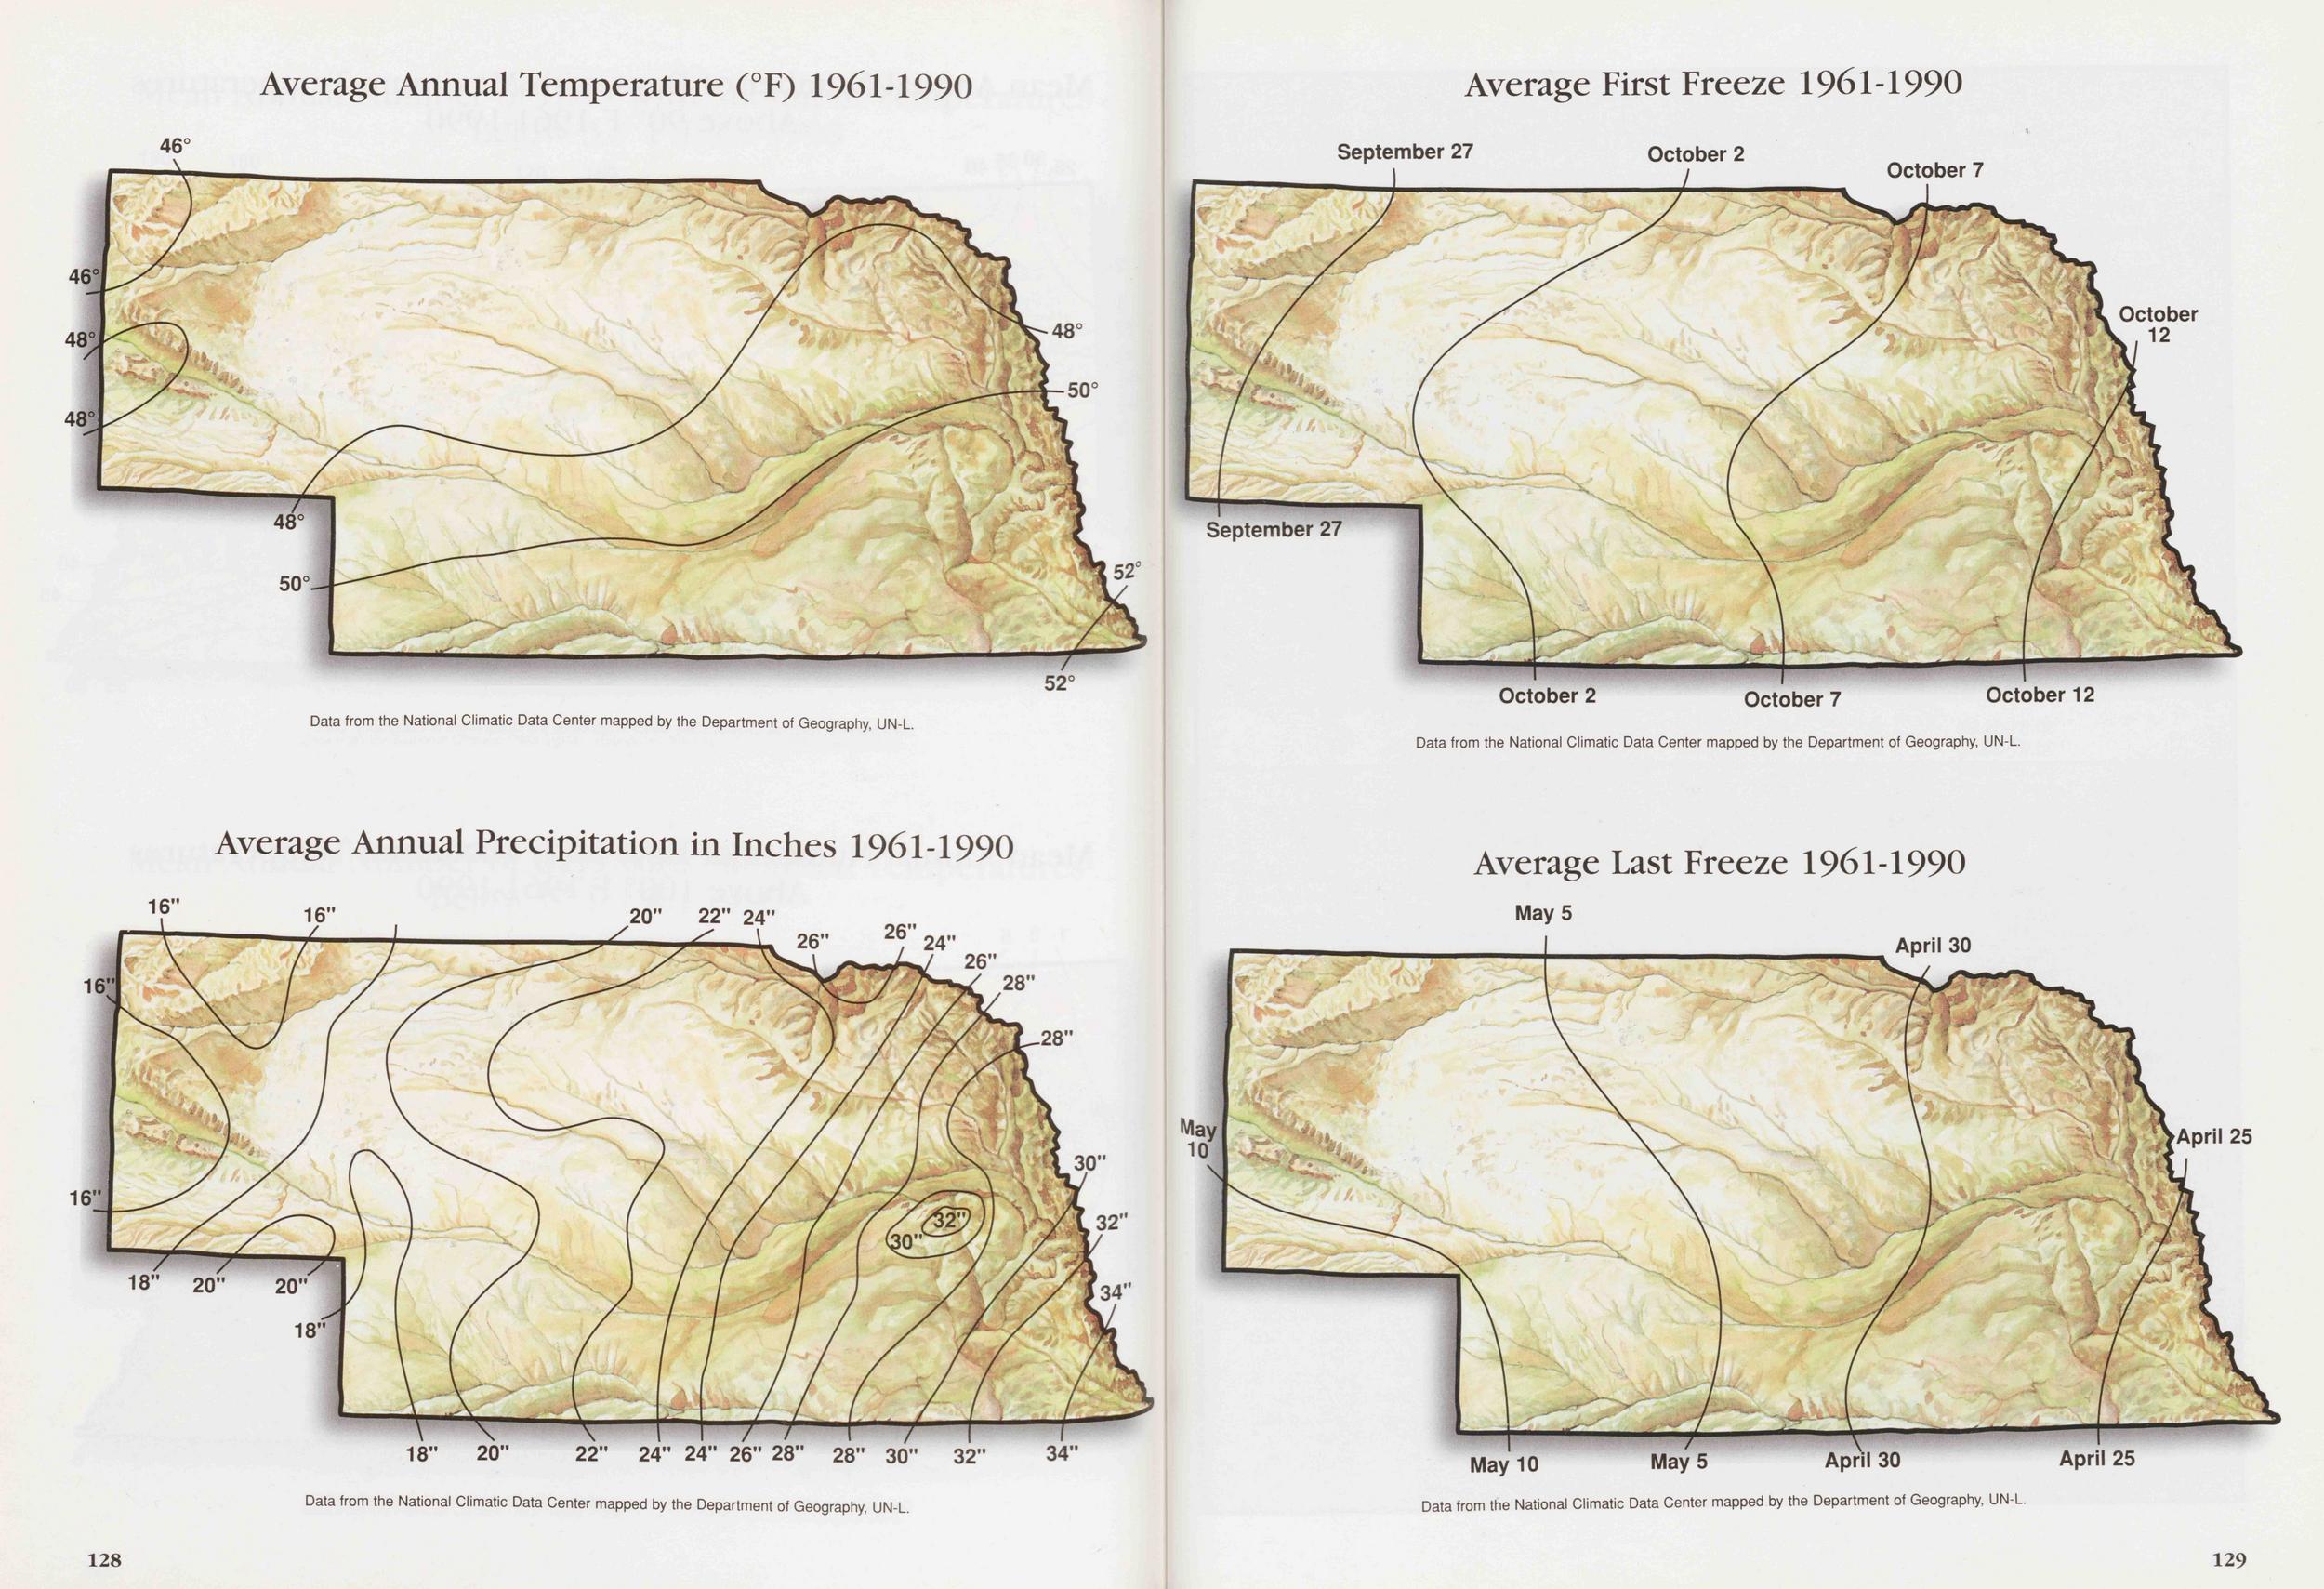
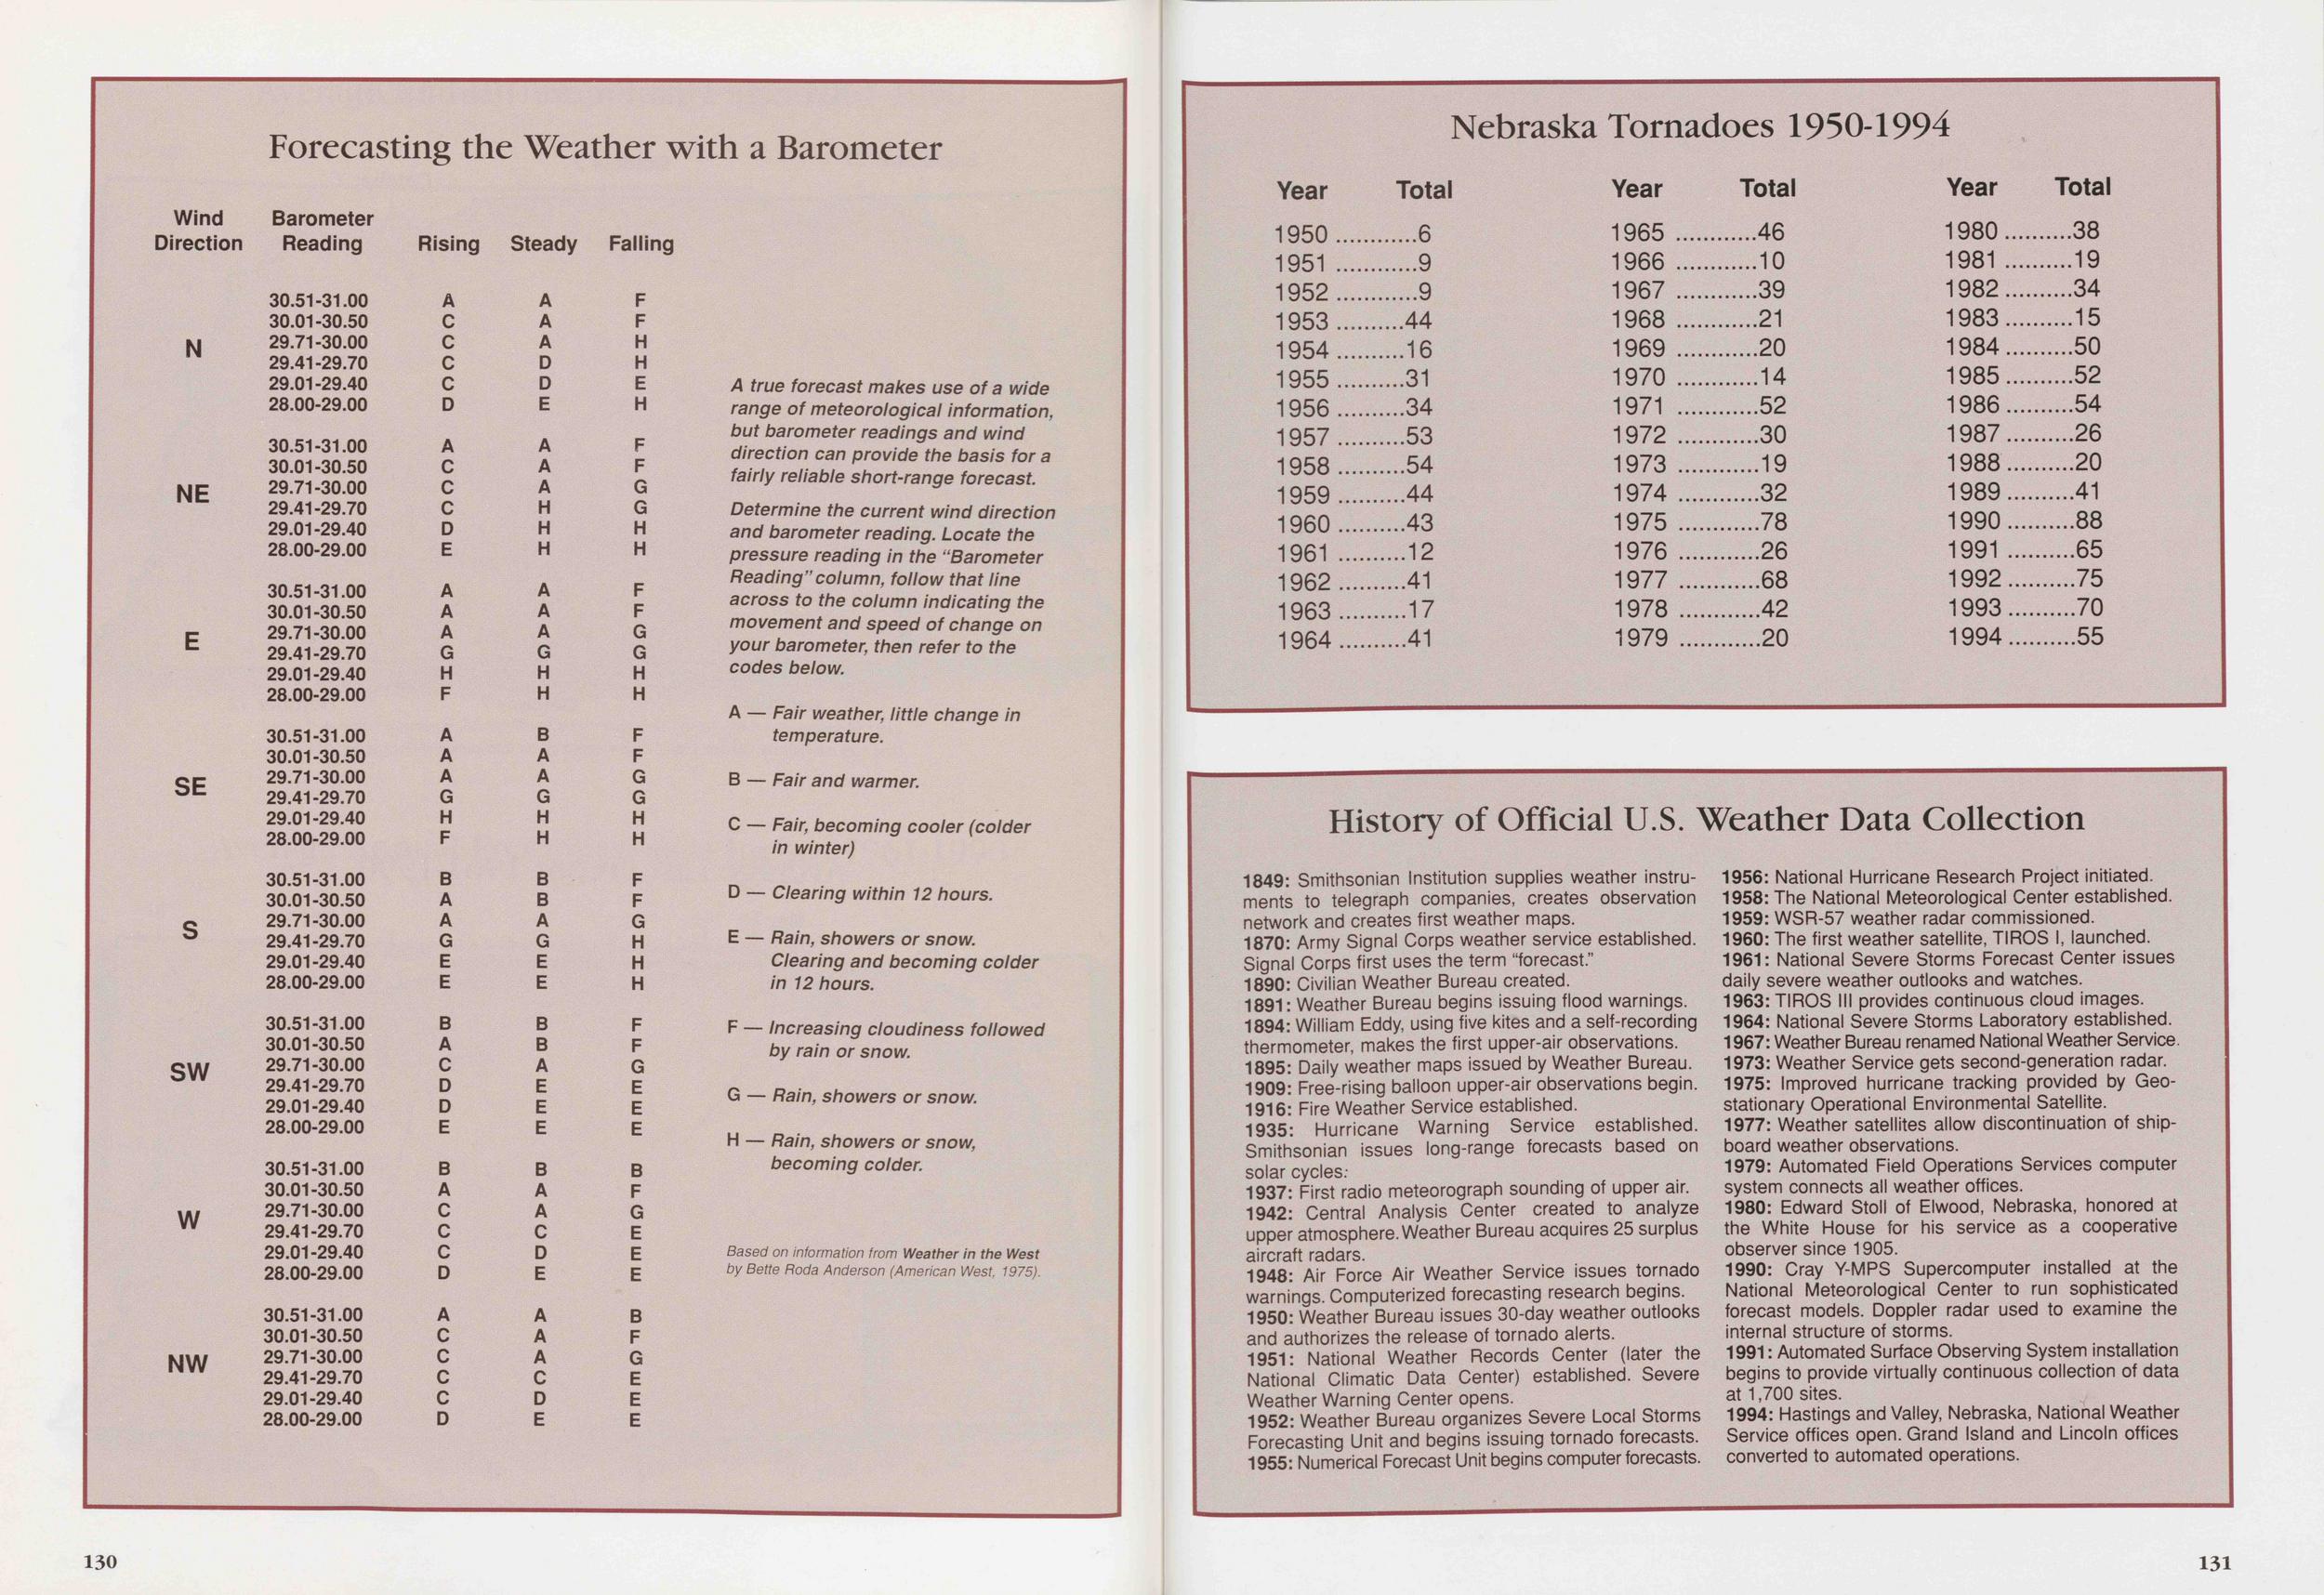 Forecasting the Weather with a Barometer Wind Barometer Direction Reading N NE SE SW W NW Rising Steady Falling 30.51-31.00 A A F 30.01-30.50 C A F 29.71-30.00 C A H 29.41-29.70 C D H 29.01-29.40 C D E 28.00-29.00 D E H 30.51-31.00 A A F 30.01-30.50 C A F 29.71-30.00 C A G 29.41-29.70 C H G 29.01-29.40 D H H 28.00-29.00 E H H 30.51-31.00 A A F 30.01-30.50 A A F 29.71-30.00 A A G 29.41-29.70 G G G 29.01-29.40 H H H 28.00-29.00 F H H 30.51-31.00 A B F 30.01-30.50 A A F 29.71-30.00 A A G 29.41-29.70 G G G 29.01-29.40 H H H 28.00-29.00 F H H 30.51-31.00 B B F 30.01-30.50 A B F 29.71-30.00 A A G 29.41-29.70 G G H 29.01-29.40 E E H 28.00-29.00 E E H 30.51-31.00 B B F 30.01-30.50 A B F 29.71-30.00 C A G 29.41-29.70 D E E 29.01-29.40 D E E 28.00-29.00 E E E 30.51-31.00 B B B 30.01-30.50 A A F 29.71-30.00 C A G 29.41-29.70 C C E 29.01-29.40 C D E 28.00-29.00 D E E 30.51-31.00 A A B 30.01-30.50 C A F 29.71-30.00 C A G 29.41-29.70 C C E 29.01-29.40 C D E 28.00-29.00 D E E A true forecast makes use of a wide range of meteorological information, but barometer readings and wind direction can provide the basis for a fairly reliable short-range forecast. Determine the current wind direction and barometer reading. Locate the pressure reading in the "Barometer Reading''column, follow that line across to the column indicating the movement and speed of change on your barometer, then refer to the codes below. A — Fair weather, little change in temperature. B — Fair and warmer. C — Fair, becoming cooler (colder in winter) D — Clearing within 12 hours. E — Rain, showers or snow. Clearing and becoming colder in 12 hours. F — Increasing cloudiness followed by rain or snow. G — Rain, showers or snow. H — Rain, showers or snow, becoming colder. Based on information from Weather in the West by Bette Roda Anderson (American West, 1975). 130 Nebraska Tornadoes 1950-1994 Year Total Year Total Year Total 1950............6 1951 ............9 1952............9 1953..........44 1954..........16 1955..........31 1956..........34 1957..........53 1958..........54 1959..........44 1960..........43 1961 ..........12 1962..........41 1963..........17 1964..........41 1965 ............46 1966 ............10 1967 ............39 1968............21 1969 ............20 1970 ............14 1971 ............52 1972 ............30 1973 ............19 1974 ............32 1975 ............78 1976 ............26 1977 ............68 1978 ............42 1979 ............20 1980..........38 1981..........19 1982..........34 1983..........15 1984..........50 1985..........52 1986..........54 1987..........26 1988..........20 1989..........41 1990..........88 1991..........65 1992..........75 1993..........70 1994..........55 History of Official U.S. Weather Data Collection 1849: Smithsonian Institution supplies weather instruments to telegraph companies, creates observation network and creates first weather maps. 1870: Army Signal Corps weather service established. Signal Corps first uses the term "forecast." 1890: Civilian Weather Bureau created. 1891: Weather Bureau begins issuing flood warnings. 1894: William Eddy, using five kites and a self-recording thermometer, makes the first upper-air observations. 1895: Daily weather maps issued by Weather Bureau. 1909: Free-rising balloon upper-air observations begin. 1916: Fire Weather Service established. 1935: Hurricane Warning Service established. Smithsonian issues long-range forecasts based on solar cycles; 1937: First radio meteorograph sounding of upper air. 1942: Central Analysis Center created to analyze upper atmosphere.Weather Bureau acquires 25 surplus aircraft radars. 1948: Air Force Air Weather Service issues tornado warnings. Computerized forecasting research begins. 1950: Weather Bureau issues 30-day weather outlooks and authorizes the release of tornado alerts. 1951: National Weather Records Center (later the National Climatic Data Center) established. Severe Weather Warning Center opens. 1952: Weather Bureau organizes Severe Local Storms Forecasting Unit and begins issuing tornado forecasts. 1955: Numerical Forecast Unit begins computer forecasts. 1956: National Hurricane Research Project initiated. 1958: The National Meteorological Center established. 1959: WSR-57 weather radar commissioned. 1960: The first weather satellite, TIROS I, launched. 1961: National Severe Storms Forecast Center issues daily severe weather outlooks and watches. 1963: TIROS III provides continuous cloud images. 1964: National Severe Storms Laboratory established. 1967: Weather Bureau renamed National Weather Service. 1973: Weather Service gets second-generation radar. 1975: Improved hurricane tracking provided by Geo- stationary Operational Environmental Satellite. 1977: Weather satellites allow discontinuation of shipboard weather observations. 1979: Automated Field Operations Services computer system connects all weather offices. 1980: Edward Stoll of Elwood, Nebraska, honored at the White House for his service as a cooperative observer since 1905. 1990: Cray Y-MPS Supercomputer installed at the National Meteorological Center to run sophisticated forecast models. Doppler radar used to examine the internal structure of storms. 1991: Automated Surface Observing System installation begins to provide virtually continuous collection of data at 1,700 sites. 1994: Hastings and Valley, Nebraska, National Weather Service offices open. Grand Island and Lincoln offices converted to automated operations. 131
 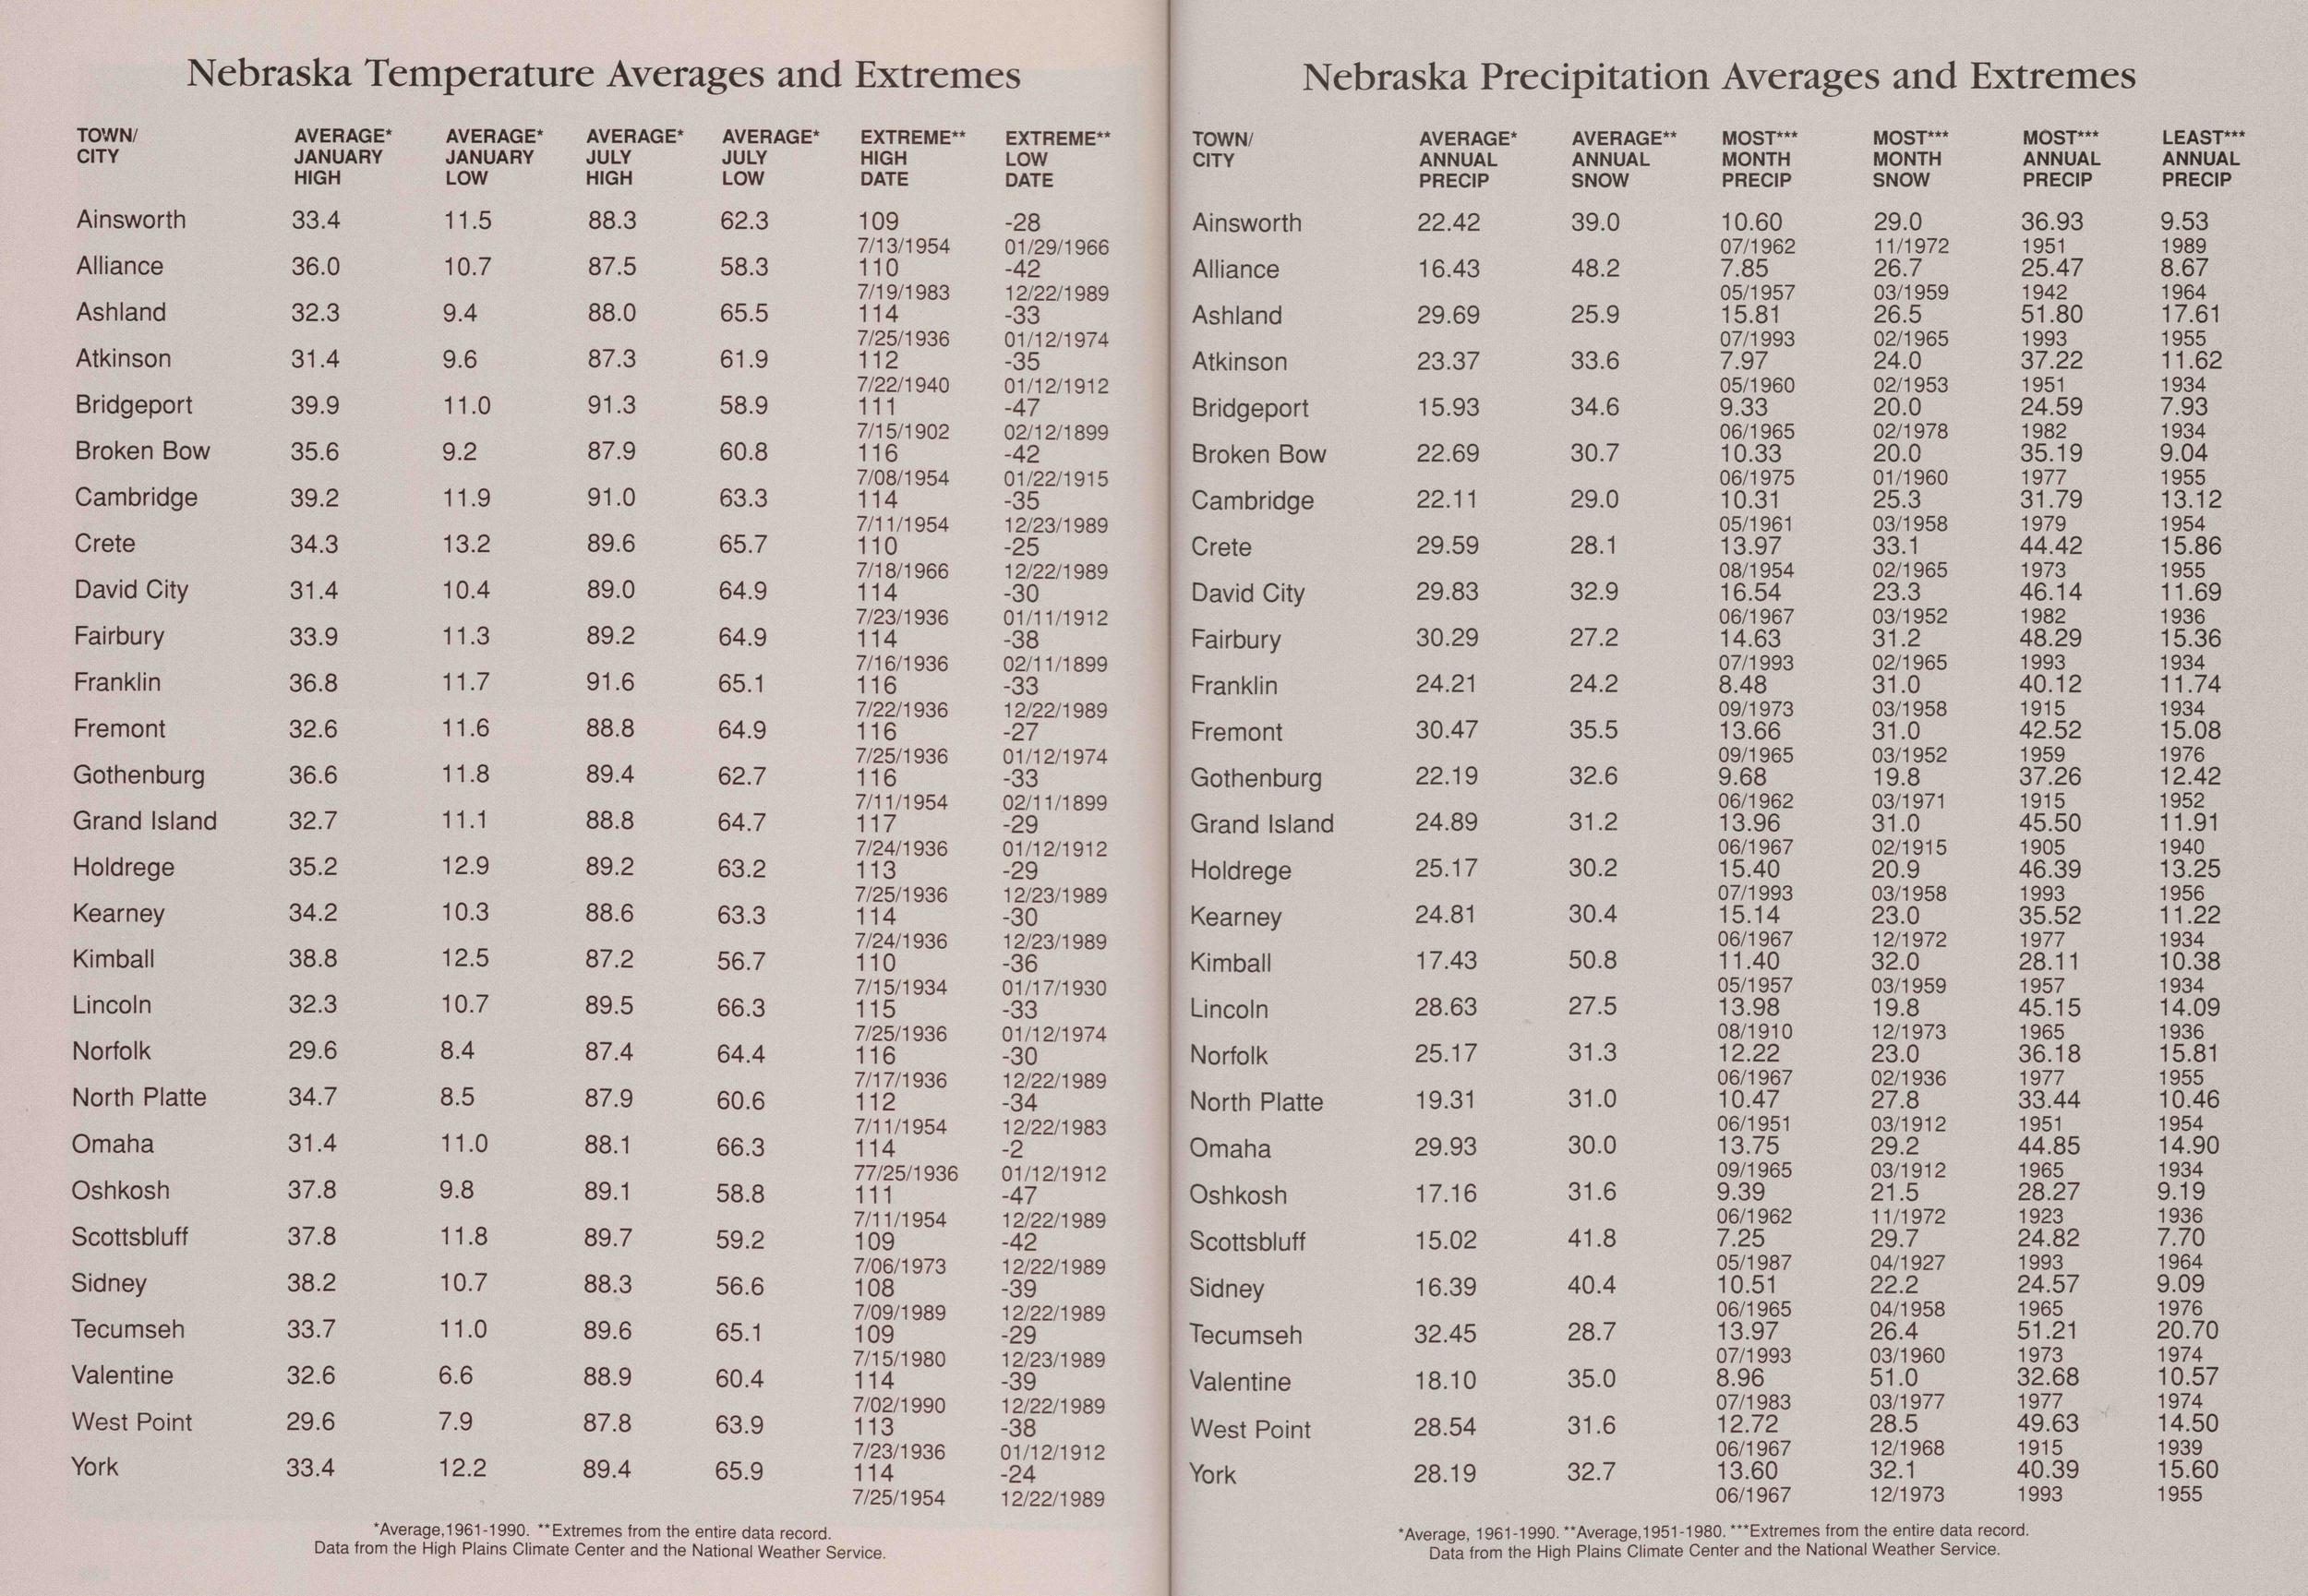 Nebraska Temperature Averages and Extremes TOWN/ CITY Ainsworth Alliance Ashland Atkinson Bridgeport Broken Bow Cambridge Crete David City Fairbury Franklin Fremont Gothenburg Grand Island Holdrege Kearney Kimball Lincoln Norfolk North Platte Omaha Oshkosh Scottsbluff Sidney Tecumseh Valentine West Point York AVERAGE* JANUARY HIGH 33.4 36.0 32.3 31.4 39.9 35.6 39.2 34.3 31.4 33.9 36.8 32.6 36.6 32.7 35.2 34.2 38.8 32.3 29.6 34.7 31.4 37.8 37.8 38.2 33.7 32.6 29.6 33.4 AVERAGE* JANUARY LOW 11.5 10.7 9.4 9.6 11.0 9.2 11.9 13.2 10.4 11.3 11.7 11.6 11.8 11.1 12.9 10.3 12.5 10.7 8.4 8.5 11.0 9.8 11.8 10.7 11.0 6.6 7.9 12.2 AVERAGE* JULY HIGH 88.3 87.5 88.0 87.3 91.3 87.9 91.0 89.6 89.0 89.2 91.6 88.8 89.4 88.8 89.2 88.6 87.2 89.5 87.4 87.9 88.1 89.1 89.7 88.3 89.6 88.9 87.8 89.4 AVERAGE* JULY LOW 62.3 58.3 65.5 61.9 58.9 60.8 63.3 65.7 64.9 64.9 65.1 64.9 62.7 64.7 63.2 63.3 56.7 66.3 64.4 60.6 66.3 58.8 59.2 56.6 65.1 60.4 63.9 65.9 EXTREME** HIGH DATE 109 7/13/1954 110 7/19/1983 114 7/25/1936 112 7/22/1940 111 7/15/1902 116 7/08/1954 114 7/11/1954 110 7/18/1966 114 7/23/1936 114 7/16/1936 116 7/22/1936 116 7/25/1936 116 7/11/1954 117 7/24/1936 113 7/25/1936 114 7/24/1936 110 7/15/1934 115 7/25/1936 116 7/17/1936 112 7/11/1954 114 77/25/1936 111 7/11 /1954 109 7/06/1973 108 7/09/1989 109 7/15/1980 114 7/02/1990 113 7/23/1936 114 7/25/1954 EXTREME** LOW DATE -28 01/29/1966 -42 12/22/1989 -33 01/12/1974 -35 01/12/1912 -47 02/12/1899 -42 01/22/1915 -35 12/23/1989 -25 12/22/1989 -30 01/11/1912 -38 02/11/1899 -33 12/22/1989 -27 01/12/1974 -33 02/11/1899 -29 01/12/1912 -29 12/23/1989 -30 12/23/1989 -36 01/17/1930 -33 01/12/1974 -30 12/22/1989 -34 12/22/1983 -2 01/12/1912 -47 12/22/1989 -42 12/22/1989 -39 12/22/1989 -29 12/23/1989 -39 12/22/1989 -38 01/12/1912 -24 12/22/1989 Nebraska Precipitation Averages and Extremes TOWN/ CITY 'Average,1961-1990. "Extremes from the entire data record. Data from the High Plains Climate Center and the National Weather Service. Ainsworth Alliance Ashland Atkinson Bridgeport Broken Bow Cambridge Crete David City Fairbury Franklin Fremont Gothenburg Grand Island Holdrege Kearney Kimball Lincoln Norfolk North Platte Omaha Oshkosh Scottsbluff Sidney Tecumseh Valentine West Point York AVERAGE* ANNUAL PRECIP 22.42 16.43 29.69 23.37 15.93 22.69 22.11 29.59 29.83 30.29 24.21 30.47 22.19 24.89 25.17 24.81 17.43 28.63 25.17 19.31 29.93 17.16 15.02 16.39 32.45 18.10 28.54 28.19 AVERAGE** ANNUAL SNOW 39.0 48.2 25.9 33.6 34.6 30.7 29.0 28.1 32.9 27.2 24.2 35.5 32.6 31.2 30.2 30.4 50.8 27.5 31.3 31.0 30.0 31.6 41.8 40.4 28.7 35.0 31.6 32.7 MOST*** MONTH PRECIP 10.60 07/1962 7.85 05/1957 15.81 07/1993 7.97 05/1960 9.33 06/1965 10.33 06/1975 10.31 05/1961 13.97 08/1954 16.54 06/1967 14.63 07/1993 8.48 09/1973 13.66 09/1965 9.68 06/1962 13.96 06/1967 15.40 07/1993 15.14 06/1967 11.40 05/1957 13.98 08/1910 12.22 06/1967 10.47 06/1951 13.75 09/1965 9.39 06/1962 7.25 05/1987 10.51 06/1965 13.97 07/1993 8.96 07/1983 12.72 06/1967 13.60 06/1967 MOST*** MONTH SNOW 29.0 11 n 972 26.7 03/1959 26.5 02/1965 24.0 02/1953 20.0 02/1978 20.0 01/1960 25.3 03/1958 33.1 02/1965 23.3 03/1952 31.2 02/1965 31.0 03/1958 31.0 03/1952 19.8 03/1971 31.0 02/1915 20.9 03/1958 23.0 12/1972 32.0 03/1959 19.8 12/1973 23.0 02/1936 27.8 03/1912 29.2 03/1912 21.5 11/1972 29.7 04/1927 22.2 04/1958 26.4 03/1960 51.0 03/1977 28.5 12/1968 32.1 12/1973 MOST*** ANNUAL PRECIP 36.93 1951 25.47 1942 51.80 1993 37.22 1951 24.59 1982 35.19 1977 31.79 1979 44.42 1973 46.14 1982 48.29 1993 40.12 1915 42.52 1959 37.26 1915 45.50 1905 46.39 1993 35.52 1977 28.11 1957 45.15 1965 36.18 1977 33.44 1951 44.85 1965 28.27 1923 24.82 1993 24.57 1965 51.21 1973 32.68 1977 49.63 1915 40.39 1993 LEAST*** ANNUAL PRECIP 9.53 1989 8.67 1964 17.61 1955 11.62 1934 7.93 1934 9.04 1955 13.12 1954 15.86 1955 11.69 1936 15.36 1934 11.74 1934 15.08 1976 12.42 1952 11.91 1940 13.25 1956 11.22 1934 10.38 1934 14.09 1936 15.81 1955 10.46 1954 14.90 1934 9.19 1936 7.70 1964 9.09 1976 20.70 1974 10.57 1974 14.50 1939 15.60 1955 'Average, 1961-1990. "Average,1951-1980. '"Extremes from the entire data record. Data from the High Plains Climate Center and the National Weather Service.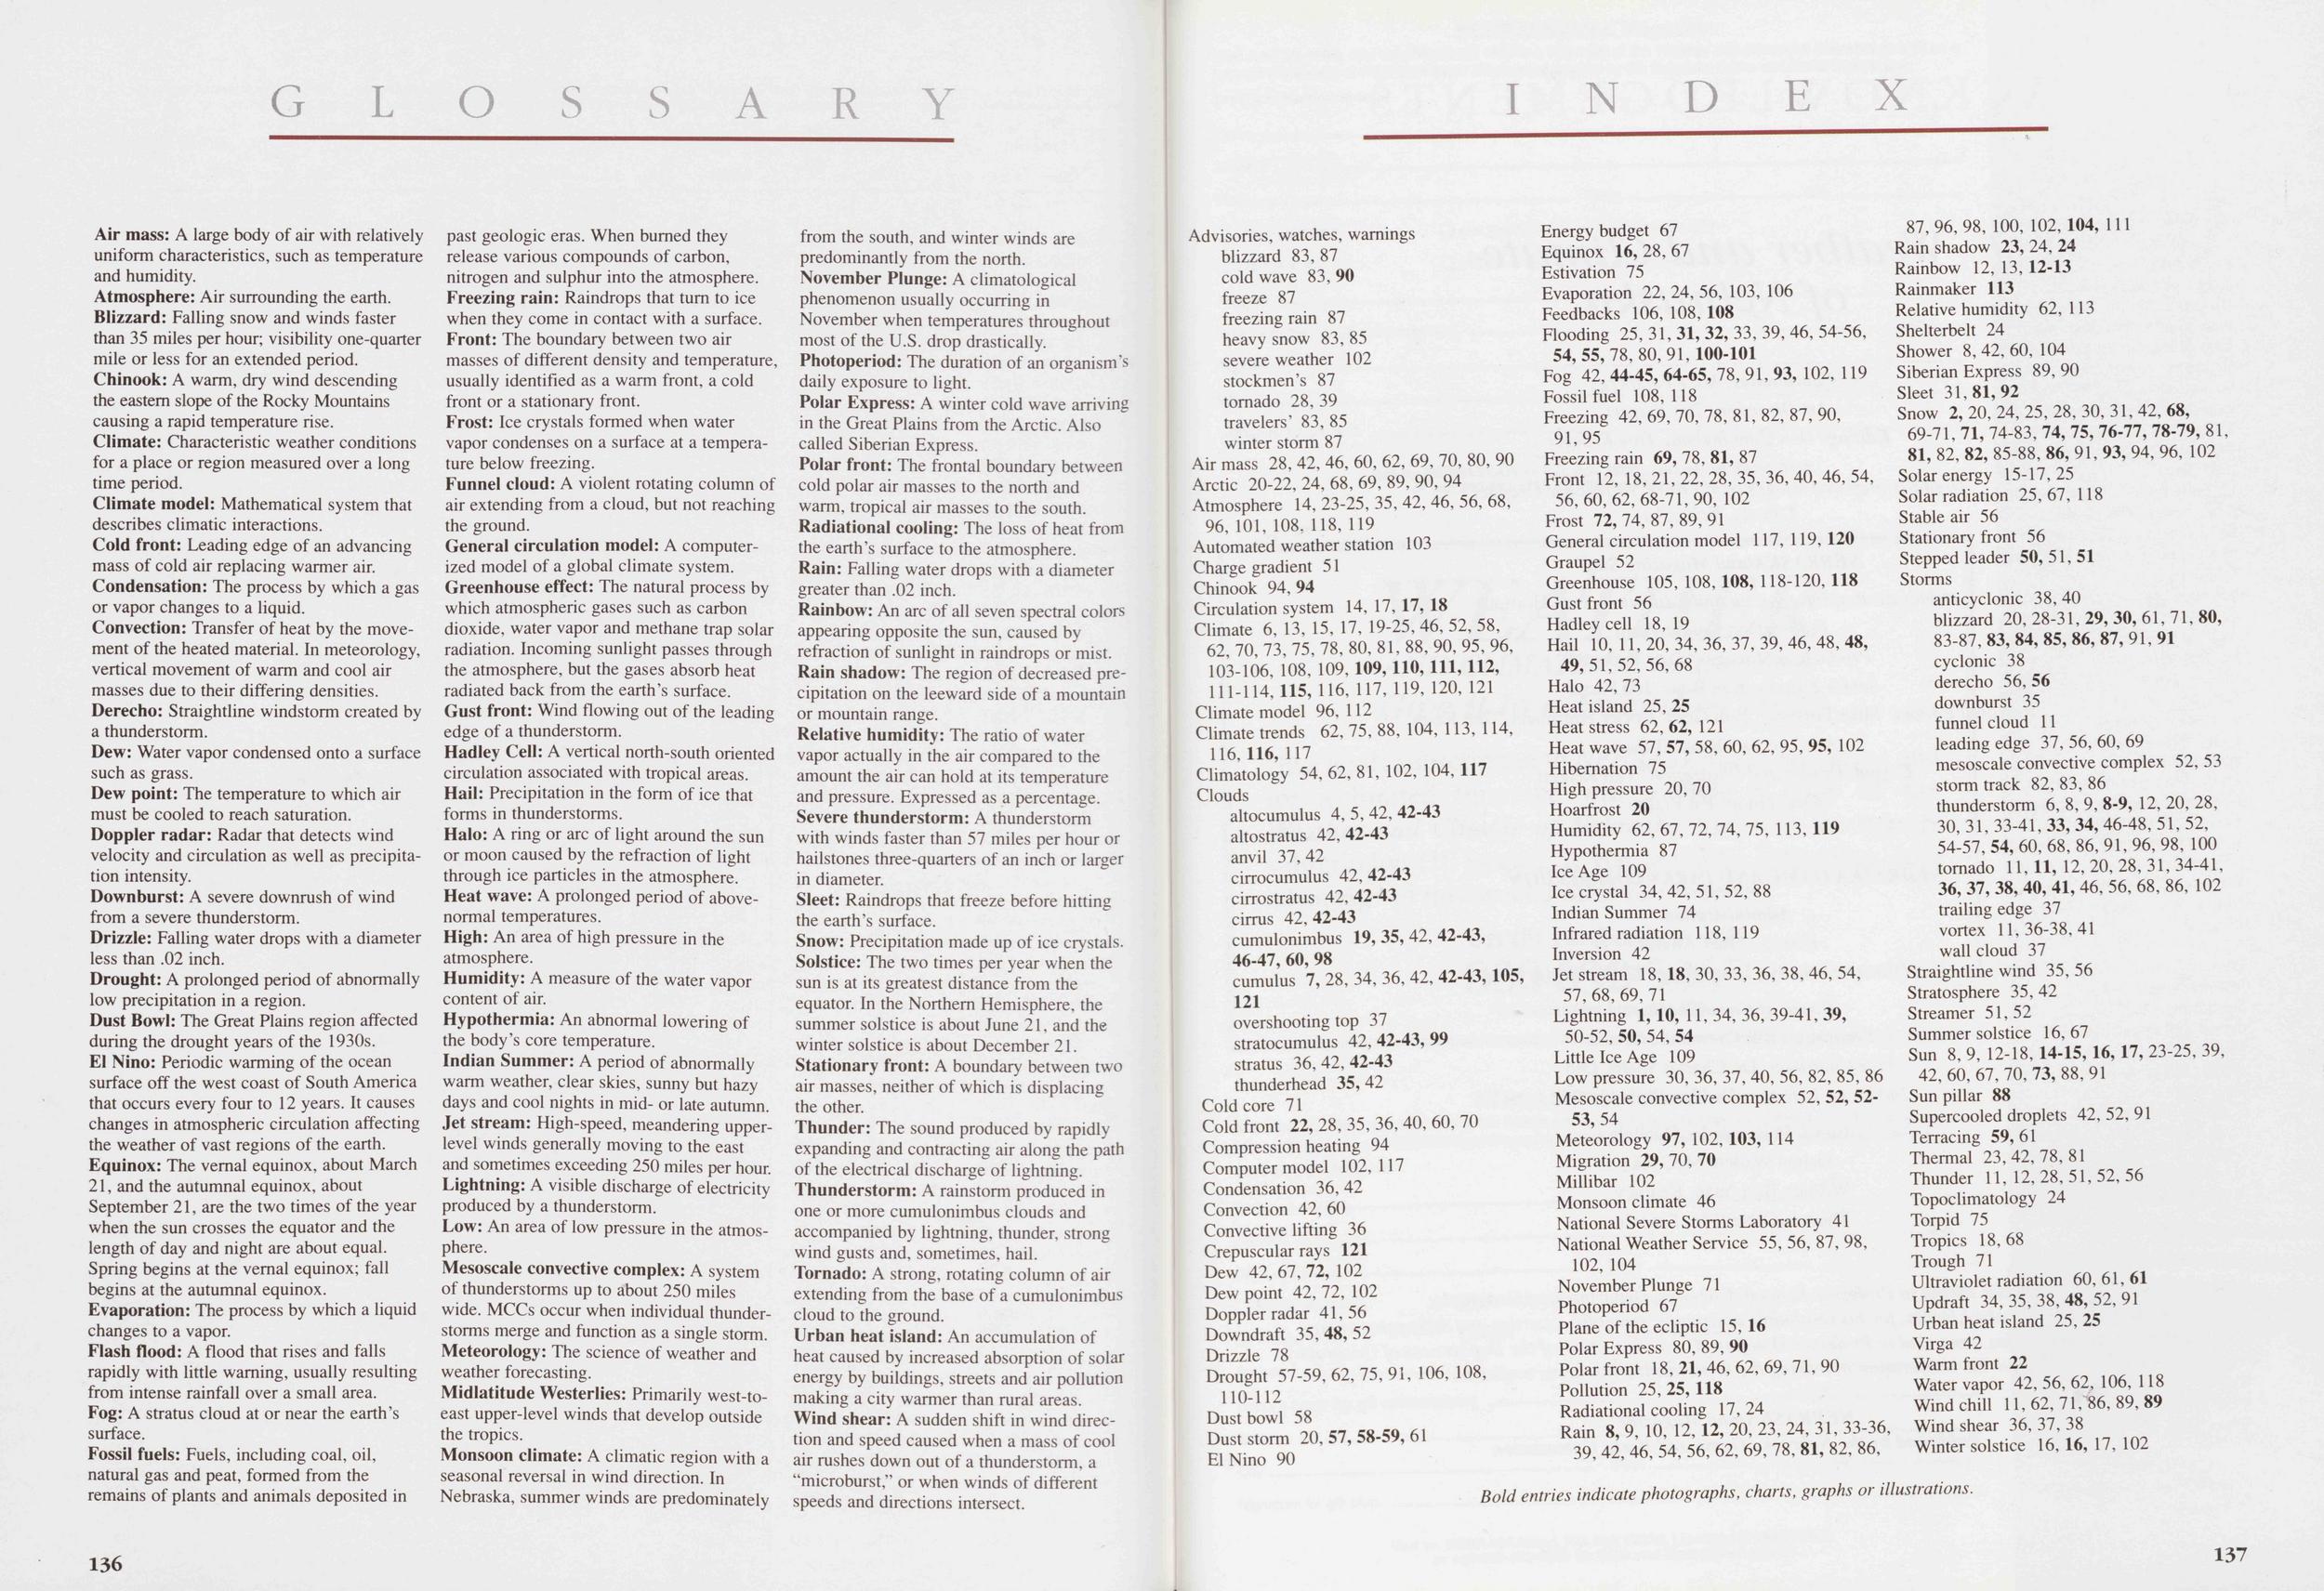
Glossary
Air mass: A large body of air with relatively uniform characteristics, such as temperature and humidity. Atmosphere: Air surrounding the earth. Blizzard: Falling snow and winds faster than 35 miles per hour; visibility one-quarter mile or less for an extended period. Chinook: A warm, dry wind descending the eastern slope of the Rocky Mountains causing a rapid temperature rise. Climate: Characteristic weather conditions for a place or region measured over a long time period. Climate model: Mathematical system that describes climatic interactions. Cold front: Leading edge of an advancing mass of cold air replacing warmer air. Condensation: The process by which a gas or vapor changes to a liquid. Convection: Transfer of heat by the movement of the heated material. In meteorology, vertical movement of warm and cool air masses due to their differing densities. Derecho: Straight line windstorm created by a thunderstorm. Dew: Water vapor condensed onto a surface such as grass. Dew point: The temperature to which air must be cooled to reach saturation. Doppler radar: Radar that detects wind velocity and circulation as well as precipitation intensity. Downburst: A severe down rush of wind from a severe thunderstorm. Drizzle: Falling water drops with a diameter less than .02 inch. Drought: A prolonged period of abnormally low precipitation in a region. Dust Bowl: The Great Plains region affected during the drought years of the 1930s. El Nino: Periodic warming of the ocean surface off the west coast of South America that occurs every four to 12 years. It causes changes in atmospheric circulation affecting the weather of vast regions of the earth. Equinox: The vernal equinox, about March 21, and the autumnal equinox, about September 21, are the two times of the year when the sun crosses the equator and the length of day and night are about equal. Spring begins at the vernal equinox; fall begins at the autumnal equinox. Evaporation: The process by which a liquid changes to a vapor. Flash flood: A flood that rises and falls rapidly with little warning, usually resulting from intense rainfall over a small area. Fog: A stratus cloud at or near the earth's surface. Fossil fuels: Fuels, including coal, oil, natural gas and peat, formed from the remains of plants and animals deposited in past geologic eras. When burned they release various compounds of carbon, nitrogen and sulphur into the atmosphere. Freezing rain: Raindrops that turn to ice when they come in contact with a surface. Front: The boundary between two air masses of different density and temperature, usually identified as a warm front, a cold front or a stationary front. Frost: Ice crystals formed when water vapor condenses on a surface at a temperature below freezing. Funnel cloud: A violent rotating column of air extending from a cloud, but not reaching the ground. General circulation model: A computerized model of a global climate system. Greenhouse effect: The natural process by which atmospheric gases such as carbon dioxide, water vapor and methane trap solar radiation. Incoming sunlight passes through the atmosphere, but the gases absorb heat radiated back from the earth's surface. Gust front: Wind flowing out of the leading edge of a thunderstorm. Hadley Cell: A vertical north-south oriented circulation associated with tropical areas. Hail: Precipitation in the form of ice that forms in thunderstorms. Halo: A ring or arc of light around the sun or moon caused by the refraction of light through ice particles in the atmosphere. Heat wave: A prolonged period of above normal temperatures. High: An area of high pressure in the atmosphere. Humidity: A measure of the water vapor content of air. Hypothermia: An abnormal lowering of the body's core temperature. Indian Summer: A period of abnormally warm weather, clear skies, sunny but hazy days and cool nights in mid- or late autumn. Jet stream: High-speed, meandering upperlevel winds generally moving to the east and sometimes exceeding 250 miles per hour. Lightning: A visible discharge of electricity produced by a thunderstorm. Low: An area of low pressure in the atmosphere. Mesoscale convective complex: A system of thunderstorms up to about 250 miles wide. MCCs occur when individual thunderstorms merge and function as a single storm. Meteorology: The science of weather and weather forecasting. Midlatitude Westerlies: Primarily west-to-east upper-level winds that develop outside the tropics. Monsoon climate: A climatic region with a seasonal reversal in wind direction. In Nebraska, summer winds are predominately from the south, and winter winds are predominantly from the north. November Plunge: A climatological phenomenon usually occurring in November when temperatures throughout most of the U.S. drop drastically. Photoperiod: The duration of an organism's daily exposure to light. Polar Express: A winter cold wave arriving in the Great Plains from the Arctic. Also called Siberian Express. Polar front: The frontal boundary between cold polar air masses to the north and warm, tropical air masses to the south. Radiational cooling: The loss of heat from the earth's surface to the atmosphere. Rain: Falling water drops with a diameter greater than .02 inch. Rainbow: An arc of all seven spectral colors appearing opposite the sun, caused by refraction of sunlight in raindrops or mist. Rain shadow: The region of decreased precipitation on the leeward side of a mountain or mountain range. Relative humidity: The ratio of water vapor actually in the air compared to the amount the air can hold at its temperature and pressure. Expressed as a percentage. Severe thunderstorm: A thunderstorm with winds faster than 57 miles per hour or hailstones three-quarters of an inch or larger in diameter. Sleet: Raindrops that freeze before hitting the earth's surface. Snow: Precipitation made up of ice crystals. Solstice: The two times per year when the sun is at its greatest distance from the equator. In the Northern Hemisphere, the summer solstice is about June 21, and the winter solstice is about December 21. Stationary front: A boundary between two air masses, neither of which is displacing the other. Thunder: The sound produced by rapidly expanding and contracting air along the path of the electrical discharge of lightning. Thunderstorm: A rainstorm produced in one or more cumulonimbus clouds and accompanied by lightning, thunder, strong wind gusts and, sometimes, hail. Tornado: A strong, rotating column of air extending from the base of a cumulonimbus cloud to the ground. Urban heat island: An accumulation of heat caused by increased absorption of solar energy by buildings, streets and air pollution making a city warmer than rural areas. Wind shear: A sudden shift in wind direction and speed caused when a mass of cool air rushes down out of a thunderstorm, a "microburst," or when winds of different speeds and directions intersect. 136
Position: 553 (19 views)